

Seasonal Trading Strategy For DAX 40 And German Stocks (Trading Rules, Setup, Backtest, Performance Analysis)

Many investors focus on searching for seasonalities in the US stock market. However, seasonal patterns can also be exploited in international stock markets.
Today we will show you a seasonal trading strategy for the German stock market. It is based on previous performance and has performed better than buy and hold since inception.
Key Takeaways
- Seasonal patterns exist in global stock markets
- German DAX shows strong fourth-quarter performance
- EWG ETF used for German market exposure
- Q4-only strategy outperforms buy-and-hold returns
- Strategy invested only about twenty-four percent time
- Risk-adjusted returns improved with seasonal timing
- Backtests show lower drawdowns than buy-hold
- Buy October, sell December seasonal rule system
In this article, we will look at how the German stock market is composed, develop a seasonal trading strategy, and backtest it.
Related reading:
Composition of the German Stock Market

The DAX 40 is Germany’s main stock market index, consisting of 40 blue-chip German companies trading on the Frankfurt Stock Exchange.
Some of its most significant components are Adidas, Airbus, Allianz, Munich Re, SAP, Deutsche Bank, and BWM, among others. It was founded in July 1988 and currently has a $1 250 billion market capitalization.
Since its inception, the DAX has returned 5.36% per year. We believe DAX futures is a fantastic trading vehicle, and you have three contracts to choose from: the big, the Mini, and the Micro. We have also published several DAX trading strategies.
However, for investors to invest in the German stock market from the US, it is much easier to use the iShares MSCI Germany ETF (ticker code is EWG). This ETF invests in large and mid-size German companies. Its biggest holdings are SAP, Siemens, and Allianz. Also, it charges a 0.50% expense ratio, perhaps a bit expensive.
Monthly Seasonalities in the DAX 40 Index
If we look at the historical monthly returns of EWG, we can see that the best time to be invested is in the year’s final quarter. During the rest of the year, the ETF trades more or less sideways.
Here are the average monthly returns of EWG since 1996:
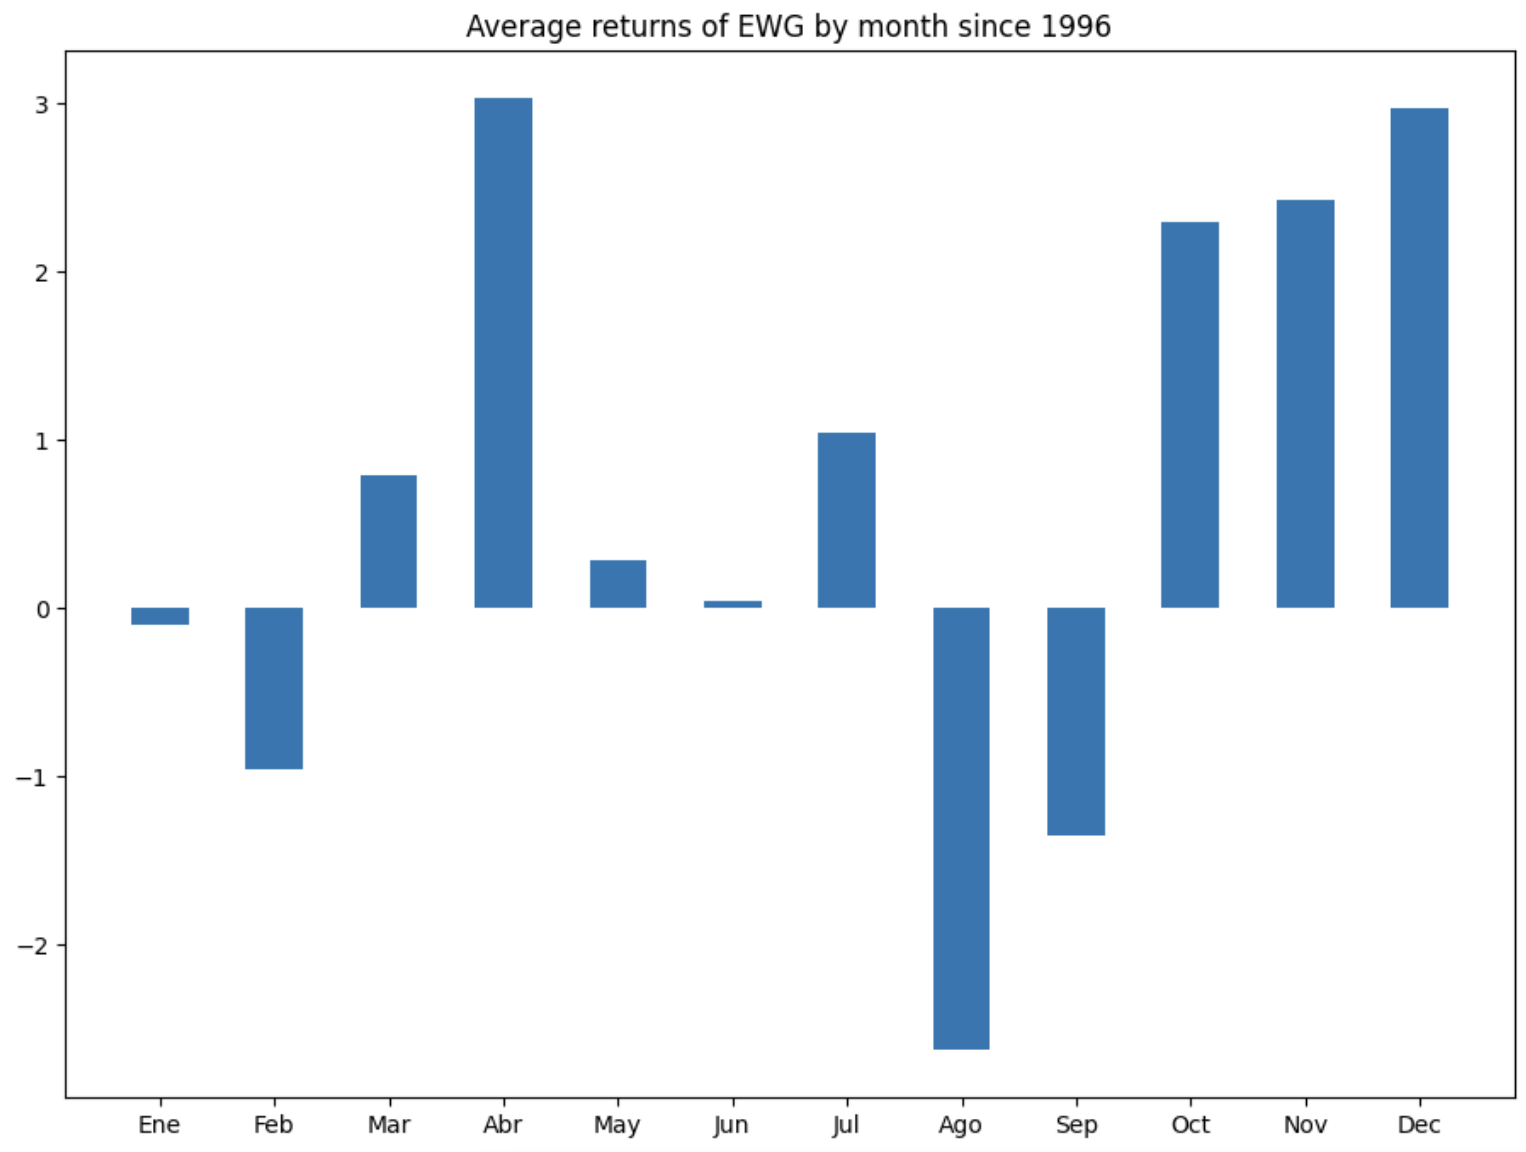
Based on this information, we can develop a seasonal trading strategy.
Seasonal trading strategy for EWG and DAX 40 – trading rules
The trading strategy is pretty simple:
Trading Rules
You find the trading rules at the bottom of the article
In other words, the strategy’s holding period in a year is only the last three months or the fourth quarter.
Seasonal trading strategy for EWG and DAX 40 – backtest
As we mentioned, we backtest the trading strategy using EWG since its inception. The data is adjusted for dividends and splits. Here is the equity curve:
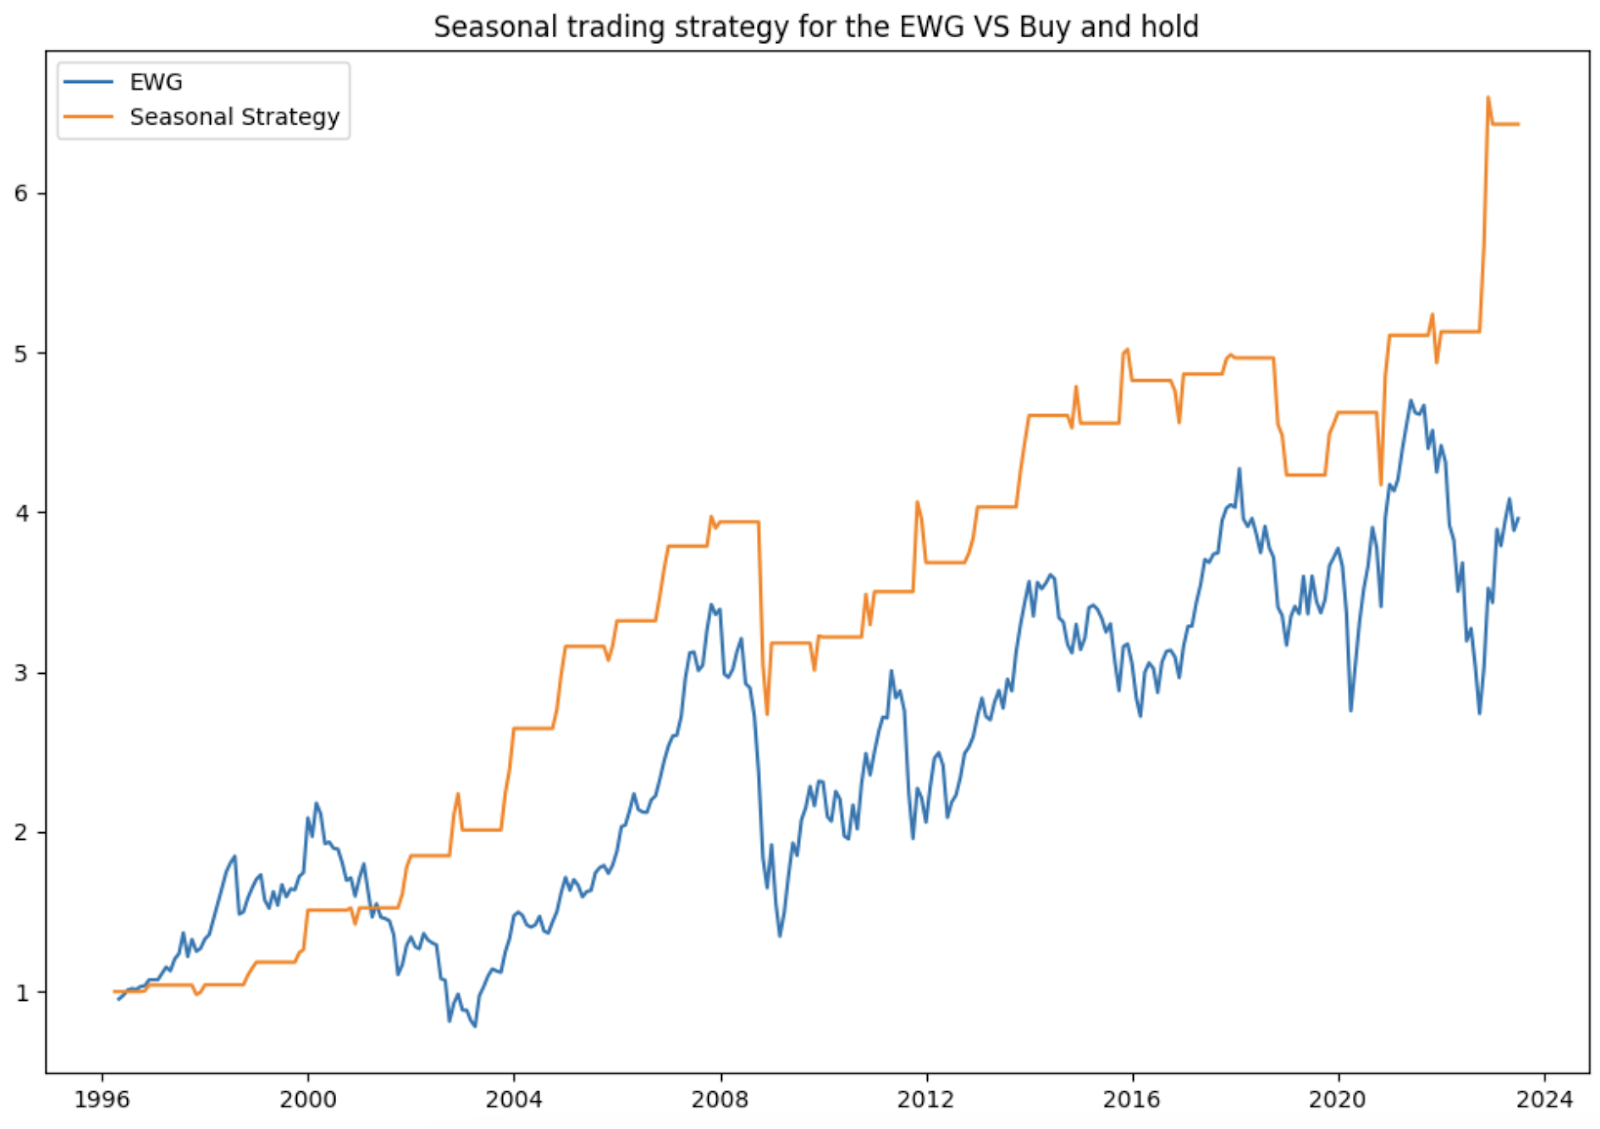
Here are some performance metrics and statistics about the strategy:
- CAGR is 7.04% (buy and hold 5.16%)
- Time spent in the market is 24.4%
- Risk-adjusted return is 29.13% (CAGR divided by time spent in the market, which is 0.24)
- Maximum drawdown is 31.2% (64.15%)
As you can see, investing in German stocks in the last quarter paid off well over the last few decades.
Seasonal trading strategy for EWG and DAX 40- conclusion
To sum up, today we developed a seasonal trading strategy for the EWG where we only invest in the last quarter of every year. The backtest proved that the strategy performs well, and one should expect it will continue to do so? We don’t know, but the same trend is pretty strong in most markets. We covered this in an article called investing only in winter trading strategy.
FAQ:
What is the DAX 40, and how is it composed?
The DAX 40 is Germany’s main stock market index, comprising 40 blue-chip German companies traded on the Frankfurt Stock Exchange. Some significant components include Adidas, Airbus, Allianz, Munich Re, SAP, Deutsche Bank, and BMW. It was founded in July 1988 and has a market capitalization of $1,250 billion.
What is the iShares MSCI Germany ETF (EWG), and why is it relevant for U.S. investors?
The iShares MSCI Germany ETF (EWG) is an exchange-traded fund that allows U.S. investors to easily invest in the German stock market. It invests in large and mid-size German companies, with significant holdings in SAP, Siemens, and Allianz. EWG is a convenient option for U.S. investors looking to access the German market.
How does the historical performance of the DAX 40 influence trading strategies?
The historical performance of the DAX 40, with a return of 5.36% per year since inception, can influence trading strategies. Analyzing historical data helps traders identify patterns and trends, leading to the development of effective trading strategies.