
A deep blue corporate marketing header image titled "Start Of The Year Rally? Stocks | Bonds & Gold," featuring a 3D-styled clipboard icon under a magnifying glass with the Quantified Strategies logo.

Start Of The Year Rally? (Stocks, Bonds, And Gold) – Backtest and Trading Rules

An informational infographic titled "Factors Behind Start of Year Rally" divided into three core sections—Reasons for Start of Year Rally, Historical Performance, and Practical Implication—set against a split white and dark blue background featuring a 3D magnifying glass icon and a green trend line.
A structured overview detailing the structural drivers, practical market implications, and core economic catalysts behind a systematic start of the year rally.

There are many seasonals in the financial markets. Today, we are looking at the performance for stocks, bonds, and gold when a new year starts. Is there a start of the year rally?

Key Takeaways

  • Start of year shows measurable stock rally
  • S&P 500 gains strongest in first days
  • Three-day holding often performs best historically
  • Gold shows positive January–February seasonality
  • Bonds display inverse early-year price behavior
  • Interest rates often rise early year
  • Effects vary strongly across decades
  • Simple year-start timing strategy tested historically

Related reading:

Start of the year rally – trading rules

In this article, we make the following trading rules:

You find the trading rules at the bottom of the article

We look at the following instruments: the cash index for S&P 500, bonds (TLT), and the gold price (from 1980).

Start of year rally in stocks?

Let’s start by looking at the performance of stocks. If we exit after 1-30 days we get the following table:

A quantitative data backtest results table for the start of the year rally strategy, detailing metrics such as Exit after N-days from 1 to 30, Average Percentage Profit/Loss, Profit Factor, number of trades, and win percentage across 63 trades.
Optimization backtest data table illustrating historical performance metrics and win probabilities based on varying holding periods (1 to 30 days) for the start of the year rally strategy.

The first column shows the results in each row.

For example, row 3 shows S&P 500 has returned 0.48% if you sell on the third trading day of the year.

The equity curve when we exit after three trading days looks like this (1960 until today):
A long-term historical backtest chart for the start of the year rally strategy in stocks, showing a portfolio equity curve rising from an initial 100,000 baseline to a final value of 149,603, with a QuantifiedStrategies.com watermark.
Historical backtest equity curve mapping the capital growth and performance metrics of a systematic start of the year rally strategy applied to stocks.

Start of the year rally – the gold price

Let’s look at the gold price. The end of December is a good period for the gold price, but does the rally continue into the new year?

The table below shows the returns from the end of the year until N-days later:

gold start of the year

From 1980 until today, we clearly see that gold has performed well in all of January and well into February.

If we own gold for 30 trading days, we get the following equity curve:
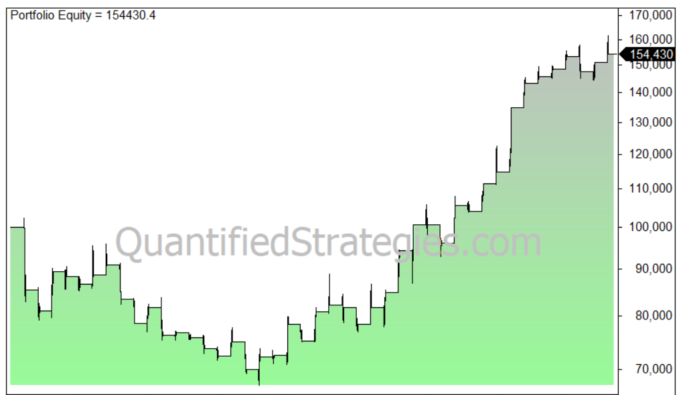
A long-term historical backtest performance chart for the start of the year rally strategy applied specifically to gold, tracking an equity curve that initially experiences a capital drawdown before steadily rising to a final portfolio value of 154,430, featuring a QuantifiedStrategies.com watermark.
Long-term algorithmic backtest equity curve mapping the risk-adjusted capital growth and recovery metrics for the start of the year rally strategy in gold markets.

However, during the 1980s, when the gold price went down, the performance was weak.

Start of the year rally – bonds

Let’s look at perhaps the most important asset – bonds and the interest rate. Bonds are important because it determines the price of money – the interest rate.
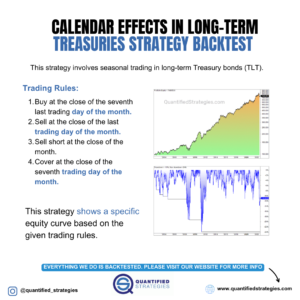
An informational graphic titled "Calendar Effects in Long-Term Treasuries Strategy Backtest" outlining four specific algorithmic trading rules for seasonal Treasury bond (TLT) trading, paired alongside a multi-decade green equity growth curve and a matching blue drawdown analysis window.
Quantitative breakdown of the rules and historical backtest performance for a long-term Treasury bond strategy exploiting monthly calendar anomalies.

As a proxy we use the the yield of the 10-year treasury bonds.

The table below shows the performance of the interest rate (not the price of the bond) from 1970 until today:
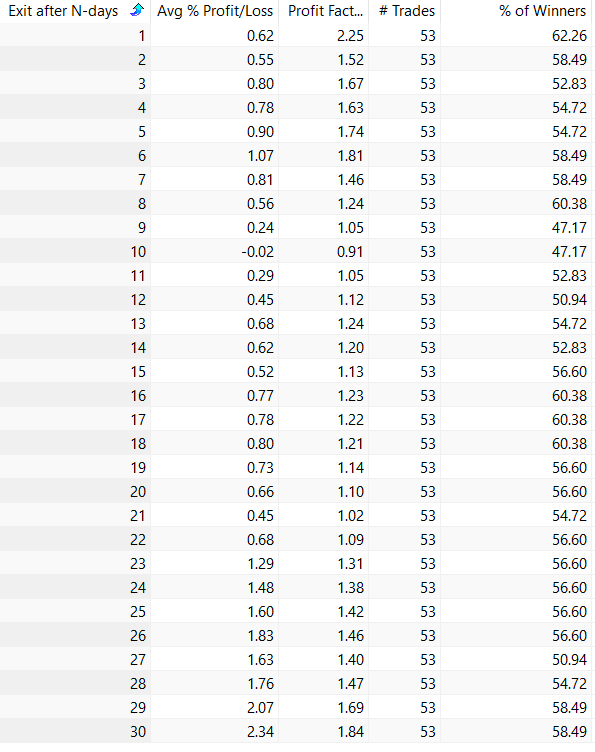
A quantitative backtest data table evaluating the performance of interest rates during the start of the year rally, displaying granular metrics including Exit after N-days from 1 to 30, Average Percentage Profit/Loss, Profit Factor, number of trades across a 53-trade sample size, and win percentages.
Granular optimization data table illustrating historical interest rate performance metrics and win probabilities from Day 1 to Day 30 for the start of the year rally bond market sub-strategy.

Column 2 shows how the rates have performed. A positive number shows that the returns have been rising, and thus the price of the bonds have gone down (because they have an inverse relationship).

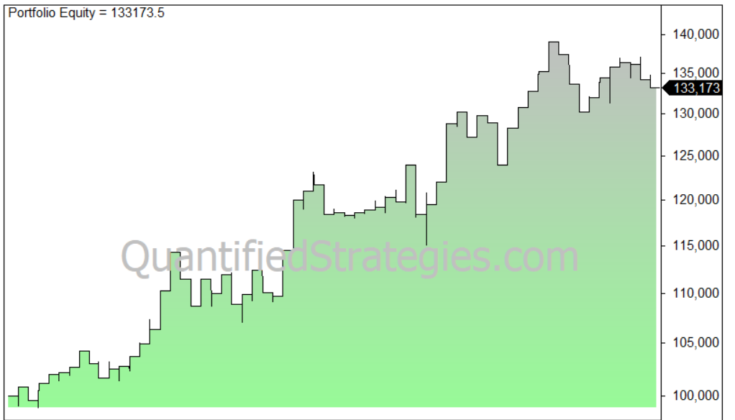
If we exit after 30 days we get the following equity curve:
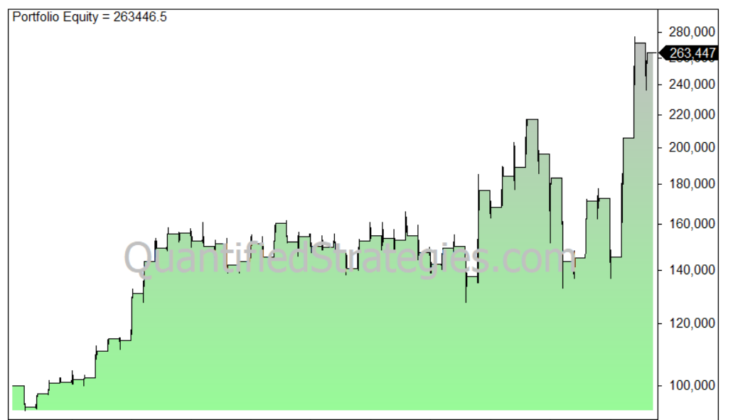
A long-term historical backtest chart for the start of the year rally strategy applied specifically to bonds, displaying an upward-sloping portfolio equity curve that grows from an initial 100,000 baseline capital, featuring a QuantifiedStrategies.com watermark.
Multi-decade algorithmic backtest equity curve validating the structural growth and performance metrics of a systematic start of the year rally strategy in the bond market.

Trading Rules

🔒 These trading rules are for members only.

Get access here

Similar Posts