

Santa Claus Rally In DAX And Euro Stoxx 50: Trading Rules, Backtest, Results

The Santa Claus Rally in DAX and Euro Stoxx 50
Our backtests show significantly better performance during the Christmas season and the end of the year. The Santa Claus rally is no myth in Europe, either! The end of year rally in DAX40 is alive and well.
Key Takeaways
- Santa Claus rally exists in European indices
- DAX and Euro Stoxx 50 show strong seasonality
- Best performance occurs in late December period
- Strategy holds positions about 6–10 days
- Entry typically around third Friday in December
- Exit occurs in early new year trading days
- Backtests show high win rates and profits
- Recent years show weaker seasonal returns
It’s a pretty well-known “fact” that stock markets tend to perform well before and during holidays, at least in the US. We wrote about the US Santa Claus Rally earlier.
In this article, we look at the end of the year rally in stocks, sometimes referred to as the Santa Claus Rally or end of the year effect, on the German DAX and Euro Stoxx 50 futures contracts.
Holiday effects in the stock market:
We have covered many seasonalities in previous articles. We recommend the following articles about seasonality among our articles about trading strategies :
- Why use seasonalities and seasonality in trading
- Trading the holiday effect in stock markets
- The Thanksgiving and Black Friday effect in the stock market
- Last trading day of the month trading strategy
- The options expiration week effect
- The turn of the month trading strategy
- First trading day of the month trading strategy
We backtest the Santa Claus rally in Dax and the Euro Stoxx 50
Instead of backtesting the local DAX futures contract, we backtest the ETF that tracks German stocks: EWG. The ETF is very liquid and has a history back to the late 1990s, and is thus one of the oldest ETFs still trading.
Please keep in mind that the results might be different if you trade (or backtest) the DAX futures contract!
We backtest the Santa Claus Rally like this:
Trading Rules
You find the trading rules at the bottom of the article
The Santa Claus rally in German stocks (DAX?)
This is the equity curve in EWG:

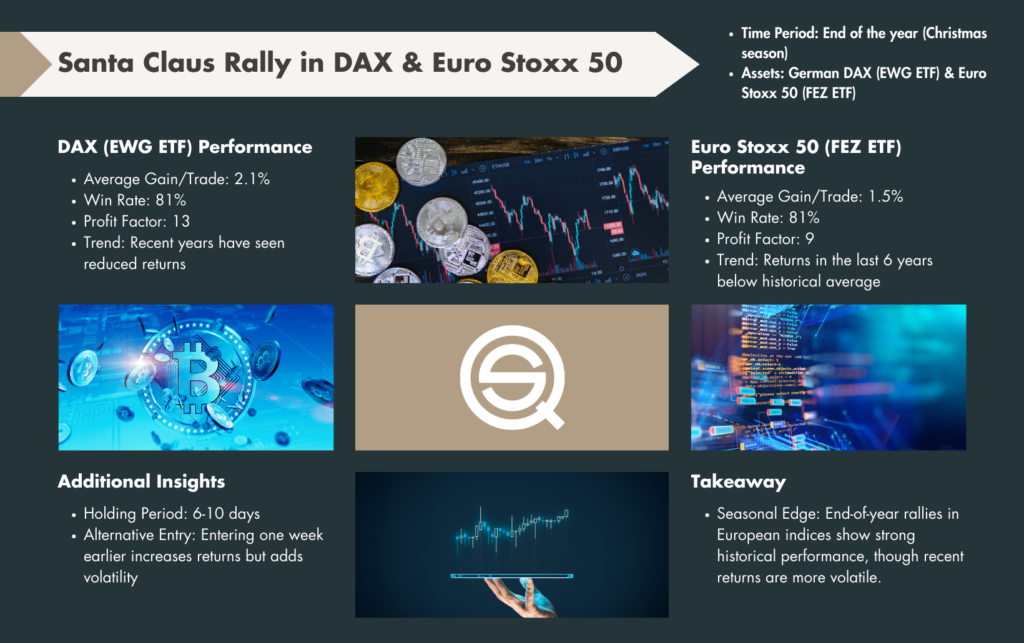
The average gain per trade is 2.1%, the win ratio is 81%, and the profit factor is 13(!). However, we can see that the returns have gone down over the last year (this is a log chart showing the relative differences).
The Santa Claus rally in Euro Stoxx 50:
Let’s look at the Euro Stoxx 50 index. For this backtest we use the ETF with the ticker code FEZ. This one goes back to 2002 and is pretty liquid.
This is the equity curve in Euro Stoxx 50:

The average gain per trade is 1.5%, the win ratio is 81%, and the profit factor is 9(!).
Just like DAX and EWG, we can see that the returns in the last 6 years were way below the average of the prior 15 years.
The positions are held on average for about 6-10 days. If we enter the position one week earlier, the holding period increases but the returns also go up, at the price of more volatile earnings.
Conclusion:
The performance over the Christmas period is significantly better than any random period during the year. The average gain any random week for DAX 40 is 0.12% and 0.18% for Euro Stoxx 50 (for comparison).
Thus, we can safely conclude there has been a Santa Claus Rally in DAX 40 and Euro Stoxx 50. That is, of course, no guarantee it will continue in the future!
FAQ:
How is the Santa Claus Rally backtested in DAX and Euro Stoxx 50?
The backtest for the Santa Claus Rally was conducted from 2001 onwards, focusing on the respective futures contracts of DAX and Euro Stoxx 50. The strategy includes a 100% margin requirement with no leverage, and the results are compounded by investing 100,000 in the first year and 100% of the equity for the next trade.
Why trade the DAX and Euro Stoxx 50?
Trading the DAX and Euro Stoxx 50 is supported by the historical performance observed during the Santa Claus Rally. The article encourages readers to explore the potential opportunities in these European markets during the end of the year.
How long are positions typically held during the Santa Claus Rally in DAX and Euro Stoxx 50?
On average, positions are held for about 12-13 days during the Santa Claus Rally in both DAX and Euro Stoxx 50. If the position is entered one week later, on the futures expiration day, the holding period decreases to 7-8 days, but the average gain per trade also drops.