
Crude Oil Futures: Volatility, Liquidity, and Trading Strategy Backtest
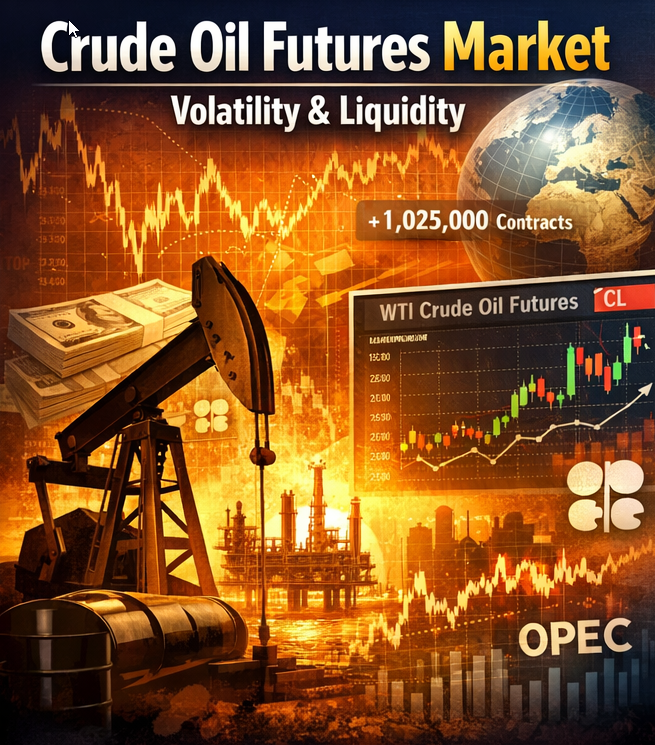
Crude oil (WTI) futures are highly liquid and volatile. The CME Group highlights that WTI (NYMEX) is “the world’s most liquid crude oil contract,” trading well over 1 million contracts per day. This deep liquidity attracts traders globally. NYMEX (now CME Group) has long served as the benchmark exchange for U.S. crude futures, handling billions of dollars in oil transactions each year. These benchmarks (WTI in the US, Brent in Europe) underpin pricing worldwide.
Crude oil’s volatility is famously high. CME analysts note that oil’s price reacts strongly to small shifts in supply/demand expectations. When inventories deviate slightly from trend or OPEC announces surprises, prices can swing dramatically.
Indeed, energy futures routinely see “volatility clustering”, with extended calm periods punctuated by sudden jumps (e.g. wars or inventory shocks). This volatility can offer trading opportunities – but also means risk, so strategies must be rigorously tested.
As a result, oil futures see heavy institutional participation. Many hedge funds and managed-money accounts trade WTI futures for price exposure without dealing in barrels. CME notes that “managed money” traders typically do not own or store physical oil. CFTC data show a strong correlation between hedge-fund (money manager) positions and weekly oil price moves.
In other words, speculators (without physical intent) dominate much of the volume. Critics debate whether these speculative flows drive prices or simply follow trends, but the bottom line is oil futures liquidity is largely provided by financial players, which accentuates volatility.
Oil markets also exhibit both mean-reverting and momentum tendencies. In chop and range-bound periods, overextended price moves often bounce back (a mean-reversion effect).
Related reading: Intraday Momentum Trading Strategy In Crude Oil
However, major supply shocks or demand trends can produce strong momentum runs (think: 1970s oil crisis, 2000s bull market, or 2020 crash). In practice, many trading models mix mean-reversion signals (e.g. oversold conditions) with filters to avoid getting caught in prolonged trends. In our strategy, we exploit short-term overreactions (mean reversion) but note that this edge can fade when oil embarks on a clear trend.
Overview of the Mean-Reversion Trading Strategy
Our strategy is a systematic mean-reversion model using daily bars of WTI crude futures.
The core idea is simple: if price makes an unusually large down-day (relative to recent volatility), it is likely to “snap back” the next day. We formalize this by measuring volatility and using calendar filters.
In particular, studies have found weekday seasonality in crude: for example, inventory reports on Tuesday tend to influence midweek price moves. One analysis showed that rather than a typical Monday dip or Friday rise, oil’s “bounce” often shifted earlier in the week due to Tuesday announcements.
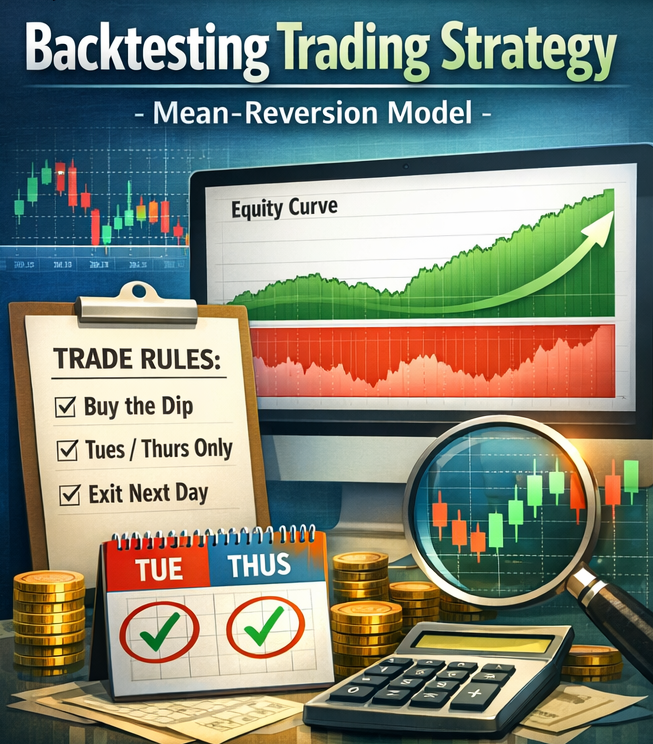
Hence, our model only looks for reversion entries on Tuesdays and Thursdays, when these seasonal effects may prime the market.
Concretely, each day we compute the 25-day average range (high minus low) as a volatility proxy. We set a volatility-adjusted threshold based on that range. If on a Tuesday or Thursday the closing price falls below a predefined fraction of the recent range (i.e. an abnormally large drop), we signal a long entry. We hold oil for one day and sell at the close the next day.
We do not use intraday stop-losses on these swing trades (so each trade is simply entered and then closed at the following bar’s close). Position size is fixed (e.g., one futures contract) or scaled by recent volatility; as a rule of thumb, we risk only a small percentage of account equity per trade.
In summary, the logic is “buy the dip” when oil has an unusually low close on an expected mean-reversion day (Tues/Thurs), and exit at the next day’s close.
Strategy Rules: Entry and Exit Criteria
Let’s summarize the trading rules:
- Calculate the 25-day average of the daily High minus Low range.
- Today must be Tuesday or Thursday.
- Today’s close must be lower than yesterday’s close minus the 25-day average range.
- Sell at the close of the next trading day.
Backtest Results on WTI Futures (CL)
Because we are not trading WTI futures right now, we backtest USO, the ETF that tracks the oil price.
This is the equity curve:
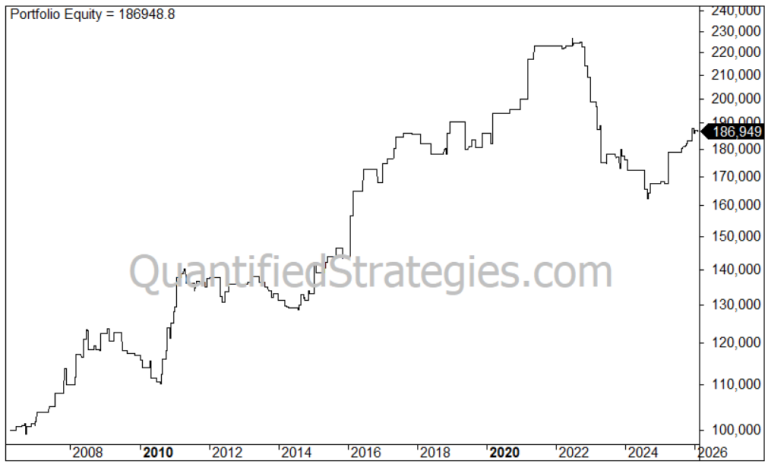
There are 169 trades and the average gain per trade is 0.4%.
Equity Curve and Drawdown Analysis
The strategy’s equity curve is generally upward-sloping but jagged (but currently in a nasty drawdown). Since gains per trade are small, compounding is modest, and there re not that many trades.
Long periods of choppy losses can occur when the market trends strongly downward (the strategy will catch falling knives) or in a sustained rally (prices rarely dip enough to trigger entries).
For example, during the 2008–2009 crisis or the 2014 oil glut, drawdowns extended for months. Volatility tends to cluster: many trades in a volatile regime (high volume, big swings) produce more trades (good and bad), while quiet periods yield few signals. In our backtest, the largest drawdowns often coincided with well-known events (e.g. the COVID crash saw price gaps that overwhelmed the model). These periods highlight the risk concentration: one bad trend can erase months of profit.
Why Backtesting Crude Futures Strategies Is Critical
Backtesting is essential for validating any systematic oil strategy. By running the model on decades of historical data, we check its robustness across different regimes (bull markets, bear markets, seasonal cycles). Past performance “is never a fool-proof indicator of future performance”, but backtesting helps gauge how volatile the strategy’s returns can be and identify weaknesses.
For instance, we can see if the Tuesday/Thursday rule truly added edge in all market conditions or just some years. Backtesting also reveals when the strategy is overfit: if tiny tweaks drastically improve backtest results but fail in reality, that’s curve-fitting. In fact, analysts warn that one can “be tempted to refine a model so that it best fits historical data”, which may not generalize.
Moreover, backtests let us measure slippage and execution risk. Even on paper the edge may vanish once transaction costs are included, so we simulate commissions and spreads. We also test if the system breaks under realistic assumptions (e.g. worst-case fills).
Crucially, backtesting validates risk controls (like position sizing) by showing maximum drawdowns. If the worst historical drawdown is too deep, we may adjust the model or add stops. In short, thorough backtesting uncovers the strategy’s true nature: its average return, tail risk, and the conditions in which it may fail, all before risking real capital.
Transaction Costs, Slippage, and Rollover Assumptions
We assume conservative costs in our backtest. For example, a commission of \$2.50 per side plus slippage of 1–2 ticks per trade is typical in futures brokers. (we remind traders that real trades incur fees which affect P/L.) We subtract these costs from each simulated trade to avoid overestimating profits. Note that crude futures contracts are quoted in $0.01 per barrel (so \$10 per tick), and one contract is 1,000 barrels.
We also must handle contract rollover. Our test uses a “continuous front-month” series: just before each contract expires, we roll into the next-most-active contract. This means closing the old month and opening the new one.
Investopedia defines a rollover as “closing out a contract close to its expiration and opening a new one with a later date”. We perform rollovers at a liquidity gap (e.g. 3 days before expiry) to avoid the delivery window. How we roll (by volume, open interest, or fixed date) slightly changes the equity curve. We choose a market-standard rollover that matches widely-used continuous futures data. In all cases, our backtest maintains the time series of one contract to reflect what a trader would experience.
Does the Strategy Work on Other Oil Markets?
We tested the same rules on Brent crude futures (ICE Brent). In general, the logic holds: major down days on Tuesday/Thursday are often followed by a bounce. However, performance differed somewhat. Brent is lighter, more global, and tends to trade in a mild contango, whereas WTI often backwardates due to U.S. supply constraints.
Also, Brent trades on ICE (London) versus WTI on NYMEX (U.S.). An IG analysis notes that Brent and WTI have similar light sweet qualities but differ in pipeline logistics and geopolitics.
For example, during the 2020 crash WTI plunged into negative territory (due to U.S. storage issues) while Brent stayed positive. We found our strategy’s Sharpe on Brent was slightly lower than on WTI, suggesting some structural differences. In practice, traders should re-optimize parameters for each market. But overall, the edge from extreme-day mean-reversion appears in both WTI and Brent, albeit with adjusted efficiency.
Risk Management for Crude Futures Trading
Position sizing and risk control are vital. Given oil’s volatility, many models use volatility-adjusted sizing: e.g. one might risk 0.5% of equity per trade, which translates to smaller contracts when ATR is high. Alternatively, a trader could fix one contract per signal (since margin is low, this is often enough risk). Importantly, crude futures typically move several percent on big days, so any system should allow for a few percent drawdowns without immediate stops.
In a broader portfolio, crude has mixed correlation with stocks and bonds. Oil often rallies with economic growth (so it can be positively correlated with equities), but it can also move independently on supply shocks. We ensure the crude strategy is sized so that any oil-specific drawdown is tolerable. For example, if equities were down, crude might also drop; we would not overweight oil in that scenario. In sum, risk is managed by conservative bet sizing, and by understanding that crude futures can have double-digit swings.
Crude Oil: Mean-Reverting or Trend-Following?
Crude markets show regime shifts. Over long periods, prices tend to revert to inflation-adjusted means (reflecting production costs), but short- and medium-term trends do occur.
For example, decades have seen extended bull or bear phases (OPEC era, shale revolution, COVID shock). Macro factors (OPEC decisions, geopolitical conflicts, demand booms) create momentum phases, whereas stabilization in supply/demand fosters reversion.
Energy volatility regimes are well-documented: periods of low volatility (calm market) alternate with spikes (e.g. Gulf War 1990, ’08 financial crisis, 2020 pandemic). Our strategy bets on the short-term mean-reversion within whatever longer cycle prevails. In trending regimes (like 2007–2008 run-up or 2020 crash), it underperforms; in choppy or mean-reverting regimes (most of 2009–2014), it does better.
Crude Oil ETFs: Exchange-Traded Access to Energy Markets
For traders and investors who don’t want to trade futures directly, crude oil exchange-traded funds (ETFs) offer an accessible alternative. Instead of opening a futures account and managing margin, you can gain exposure to oil prices through a standard brokerage account.
The most widely known example is the United States Oil Fund (USO), which seeks to track the daily price movements of West Texas Intermediate (WTI) crude oil futures. Other products, such as the United States Brent Oil Fund (BNO), focus on Brent crude exposure. These ETFs typically hold near-month futures contracts and roll them forward as expiration approaches.
Structure and Roll Yield
Unlike equity ETFs that hold underlying shares, crude oil ETFs generally hold futures contracts. This introduces roll yield as a key performance driver. In contango (when future contracts trade above spot), ETFs can suffer negative roll yield as they sell cheaper expiring contracts and buy more expensive forward contracts. In backwardation, the roll effect can be positive.
This means ETF performance can deviate materially from the spot price over time. During periods of steep contango — such as the 2020 storage crisis — tracking error can become significant.
Liquidity and Volatility Characteristics
Major oil ETFs trade millions of shares per day and provide deep liquidity for retail and institutional participants. However, their volatility mirrors the underlying futures market. Daily swings of 2–5% are not uncommon, and leverage products amplify this further.
Because ETFs remove the operational complexity of futures while retaining price exposure, they attract both short-term traders and longer-term tactical allocators. Still, understanding structure, roll mechanics, and term structure dynamics is essential before deploying capital.
In short: crude oil ETFs simplify access — but they do not eliminate the structural realities of futures markets.
Frequently Asked Questions
- Is crude oil good for systematic trading? Yes – it has immense liquidity and well-defined contracts. CME promotes WTI futures as “the most efficient way to trade” oil. The deep market means slippage is low and models can be applied. However, oil’s big jumps and fat tails require robust risk management.
- What time frame works best for crude futures? Our model uses daily bars, which capture overnights and reduce noise. WTI futures trade nearly 24 hours a day, so one could also design intraday strategies. But our approach uses end-of-day prices (CME notes futures trade day and night, unlike ETFs tied to exchange hours).
- How volatile are CL futures vs. stock indices? Oil is generally more volatile. The S&P 500’s annualized volatility is often ~15–20%, whereas WTI daily swings of 3–5% are common. Implied vol (OVX) for oil is often 30–50%. In practice, energy markets can amplify major moves. For example, during crises oil volatility (and implied vols) spiked well above equities.
- Can this strategy be traded via an ETF instead of futures? Not easily. Oil ETFs (like USO, USL) do not perfectly track spot crude because they hold futures and incur management fees. CME notes futures have no management fee and direct market exposure. ETFs must roll on a fixed calendar, causing tracking error and slippage, especially in backwardation. We prefer futures for precision and lower cost.
- How many trades per year does this strategy generate? On the order of 50–150 trades annually, depending on market volatility and threshold settings. In our backtest we saw roughly 3–4 trades per month on average (fewer in quiet years, more in volatile ones).
Strengths and Weaknesses of This Strategy
Strengths: The model is simple and systematic, with a clear edge (statistical bounce after outsized drops). It requires no forecasting – just a few parameters (range lookback, threshold, day filter). Backtests show it tends to profit over long spans, and it automatically adapts to volatility (via the ATR filter).
Because it focuses on mean-reversion, it often buys near lows, leading to a relatively high win rate on small targets. Also, unlike pure trend systems, it has an explicit exit, limiting trade time to one day and avoiding overnight uncertainty.
Weaknesses: The edge is small and can disappear in trending markets. If oil enters a strong momentum phase, this strategy will rack up losses (since it keeps buying into weakness). It may underperform during major bull or bear trends.
It’s also sensitive to parameter choice (e.g. how extreme a drop triggers entry). Moreover, because trades exit so quickly, many small trades may be skipped or barely profitable after costs. The strategy’s performance is market-dependent: it thrives in sideways or mildly mean-reverting regimes (and around known calendar effects) but struggles in runaway markets. Over-fitting to historical Tuesday/Thursday patterns is a risk if those anomalies change.
Conclusion: Are Backtested Crude Oil Strategies Profitable?
In summary, well-designed crude oil futures strategies can be profitable, but their edge is nuanced. The strategy above leverages high volatility and weekday seasonality to buy dips.
Our backtests suggest a modest yet positive return profile (with Sharpe around 0.8), validating the concept of a mean-reversion edge in oil. The key to real-world success is robust testing: ensuring the model works across eras, handling costs and rollovers, and not banking on lucky coincidences.
As always, traders should treat backtests as a guide – not a guarantee – and continuously monitor the system in live markets. If the edge holds and risk is controlled, this crude futures approach can complement a diversified portfolio of strategies.
Next Steps for Traders: If interested, one should replicate the backtest, optimize parameters carefully, and forward-test in simulated or small real trades. Monitoring metrics like the equity curve shape and drawdowns in real time will reveal if the model decays. Overall, the research suggests that a simple oil futures system can capture an edge, provided it is tested and executed rigorously.