-
199,00 $
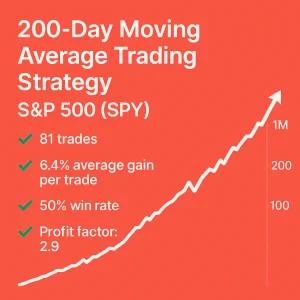
A classic long-term trend-following strategy using the 200-day moving average – with a small twist for improved performance. Backtested on the SPY ETF tracking the S&P 500. ✔️ 81 trades✔️ 6.4% average gain per trade✔️ 50% win rate✔️ Profit factor: 2.9✔️ 6.9% annual return (CAGR)✔️ 70% market exposure✔️ Risk-adjusted return: 9.9%✔️ Max drawdown: -22% (Buy…
-
199,00 $
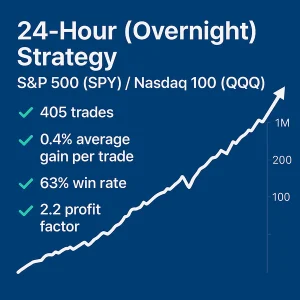
A long-only trading strategy that enters at the close and exits at the close the following trading day – holding for exactly 24 hours. Built on two entry variables and backtested on the SPY ETF (also applicable to QQQ). This was our Monthly Trading Edge for October 2023 (Gold and Platinum Members). ✔️ 405 trades✔️…
-
390,00 $
A trio of long-only swing trading strategies built for the Nasdaq 100 – thoroughly backtested on the QQQ ETF for consistent performance across market conditions. ✔️ 492 trades✔️ 0.75% average gain per trade✔️ 71% win rate✔️ Profit factor: 2.3✔️ 14.3% annual return (CAGR)✔️ 29% market exposure✔️ Risk-adjusted return: 49%✔️ Max drawdown: -31% For more info…
-
199,00 $
A set of three complementary trend-following strategies with unique entry signals and a shared exit method – all backtested on the SPY ETF tracking the S&P 500. ✔️ 22 trades✔️ 31.9% average gain per trade✔️ 77% win rate✔️ Profit factor: 6✔️ 7.6% annual return (CAGR)✔️ 81% market exposure✔️ Risk-adjusted return: 9.4%✔️ Max drawdown: -35% For…
-
199,00 $
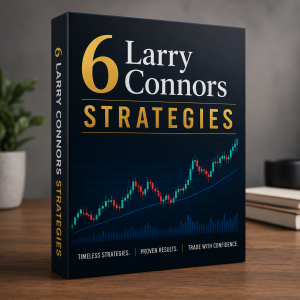
We compiled 6 Larry Connors strategies into a single product at the price of one strategy. We added a variable. Backtested on the ETF that tracks the S&P 500 (SPY). The strategy has code for Amibroker and Tradestation/Easy Langauge. Published in autumn 2021.
-
199,00 $
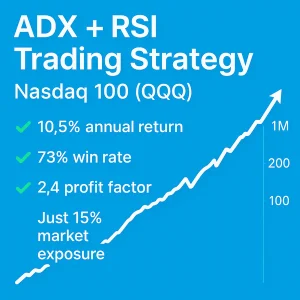
A swing trading strategy combining ADX and RSI indicators for precision entries in trending conditions – backtested on the QQQ ETF tracking the Nasdaq 100. ✔️ 258 trades✔️ 1% average gain per trade✔️ 73% win rate✔️ Profit factor: 2.4✔️ 10.5% annual return (CAGR)✔️ 15% market exposure✔️ Risk-adjusted return: 70%✔️ Max drawdown: -23% You’ll get the…
-
199,00 $
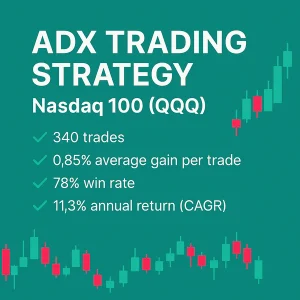
A trend-following strategy using the ADX indicator in combination with a secondary filter – backtested on the QQQ ETF for high-probability entries in trending environments. ✔️ 340 trades✔️ 0.85% average gain per trade✔️ 78% win rate✔️ Profit factor: 2.2✔️ 11.3% annual return (CAGR)✔️ 17% market exposure✔️ Risk-adjusted return: 65%✔️ Max drawdown: -21% You’ll get the…
-
199,00 $
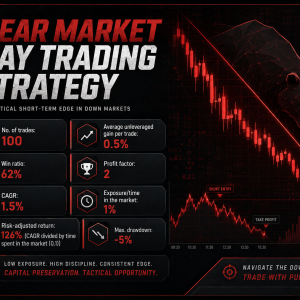
The strategy trades only during a bear market and from the long side. The strategy was our monthly trading edge for September 2025. 9100trades 0.5% average gain per trade 62% win rate Profit factor: 2 1.5% annual return (CAGR) 1% market exposure Risk-adjusted return: 126% Max drawdown: -5% You’ll get the full trading rules –…
-
199,00 $
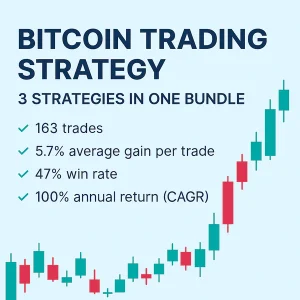
A diversified bundle of three Bitcoin trading strategies: one mean reversion, one seasonal, and one momentum-based – all designed to capture different market behaviors in the volatile world of crypto. ✔️ 163 trades✔️ 5.7% average gain per trade✔️ 47% win rate✔️ Profit factor: 2✔️ 100% annual return (CAGR)✔️ 60% market exposure✔️ Risk-adjusted return: 168%✔️ Max…
-
199,00 $
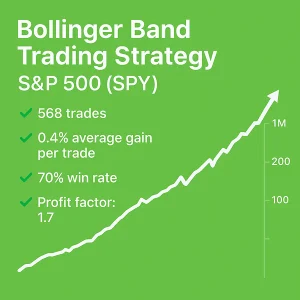
A backtested short-term swing trading strategy built on Bollinger Bands – designed to capture volatility compression and expansion on the SPY ETF tracking the S&P 500. ✔️ 568 trades✔️ 0.4% average gain per trade✔️ 70% win rate✔️ Profit factor: 1.7✔️ 6.5% annual return (CAGR)✔️ 20% market exposure✔️ Risk-adjusted return: 16%✔️ Max drawdown: -18% You’ll get…
-
199,00 $
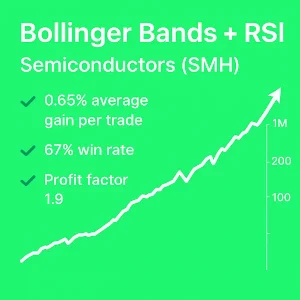
A long/short swing trading strategy combining Bollinger Bands and RSI – backtested on the SMH ETF tracking the semiconductor sector for robust, data-driven signals. ✔️ 297 trades✔️ 0.65% average gain per trade✔️ 67% win rate✔️ Profit factor: 1.9✔️ 8.3% annual return (CAGR)✔️ 16% market exposure✔️ Risk-adjusted return: 51%✔️ Max drawdown: -13% You’ll get the full…
-
199,00 $
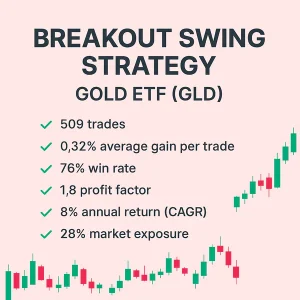
A backtested swing trading strategy built on breakout setups with three variables. Entries occur at the close, with exits a few days later. Tested on GLD – the ETF tracking the price of gold. ✅ 509 trades✅ 0.32% average gain per trade✅ 76% win rate✅ Profit factor: 1.8✅ 8% annual return (CAGR)✅ 28% market exposure✅…
-
390,00 $
4 trading strategies for the S&P500 for the ETF with the ticker code SPY. We have not backtested on @ES, but it might work if trading the same opening hours as SPY. You’ll get the full trading rules – ready to test and validate. Some example code for popular platforms is included. Want it? Just…
-
490,00 $
The short-selling strategies package consists of 4 (not 3 as indicated on the image) trading strategies that are backtested on three different ETFs. We have not backtested on @ES or any other contract, but it might work if trading same opening hours as SPY. All three short-selling strategies have not been published earlier on the…
-
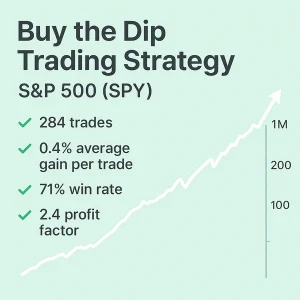
199,00 $
A mean reversion swing strategy that capitalizes on pullbacks during long-term bullish trends – backtested on the SPY ETF tracking the S&P 500. ✔️ 284 trades✔️ 0.4% average gain per trade✔️ 71% win rate✔️ Profit factor: 2.4✔️ 3.4% annual return (CAGR)✔️ 9% market exposure✔️ Risk-adjusted return: 34%✔️ Max drawdown: -14% You’ll get the full trading…
-
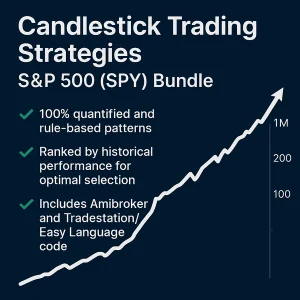
199,00 $ – 418,00 $Price range: 199,00 $ through 418,00 $
A complete bundle of candlestick-based trading strategies – fully quantified, data-driven, and backtested on the SPY ETF. Includes pattern rankings and ready-to-use trading code. ✔️ 100% quantified and rule-based patterns✔️ Ranked by historical performance for optimal selection✔️ Includes Amibroker and Tradestation/Easy Language code You’ll get the full trading rules – ready to test and validate….
-
199,00 $
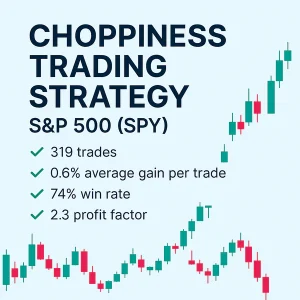
A swing trading strategy partially based on the Choppiness Index – designed to detect and adapt to choppy versus trending conditions. Backtested on the SPY ETF for consistent short-term performance. ✔️ 319 trades✔️ 0.6% average gain per trade✔️ 74% win rate✔️ Profit factor: 2.3✔️ 5.5% annual return (CAGR)✔️ 10% market exposure✔️ Risk-adjusted return: 55%✔️ Max…
-
199,00 $
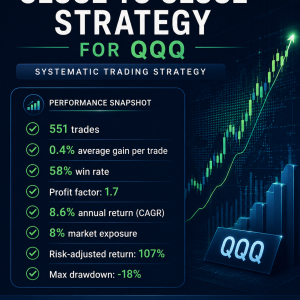
The strategy buys at the close and sells at the next close (24 hours later). Backtested on the ETF that tracks the Nasdaq 100 (QQQ). This was our trading edge for May 2026. ✔️ 551 trades✔️ 0.4% average gain per trade✔️ 58% win rate✔️ Profit factor: 1.7✔️ 8.6% annual return (CAGR)✔️ 8% market exposure✔️ Risk-adjusted…
-
199,00 $
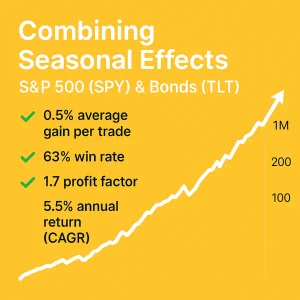
A portfolio strategy that combines two long-standing seasonal effects—one in stocks, one in bonds—into a complementary system. Backtested on the SPY and TLT ETFs to demonstrate the power of diversification through seasonality. ✔️ 467 trades✔️ 0.5% average gain per trade✔️ 63% win rate✔️ Profit factor: 1.7✔️ 5.5% annual return (CAGR)✔️ 22% market exposure✔️ Risk-adjusted return:…
-
199,00 $
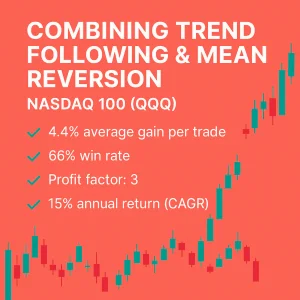
This strategy blends two complementary approaches—trend following and mean reversion—into one robust system. Backtested on the QQQ ETF, it demonstrates how combining different edges can enhance performance and reduce risk. ✔️ 99 trades✔️ 4.4% average gain per trade✔️ 66% win rate✔️ Profit factor: 3✔️ 15% annual return (CAGR)✔️ 72% market exposure✔️ Risk-adjusted return: 21%✔️ Max…
-
199,00 $
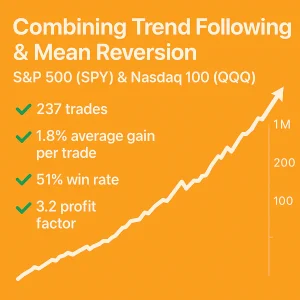
A hybrid strategy that combines a long-term trend-following approach with a short-term mean reversion component. Backtested on both SPY and QQQ ETFs, with a stronger equity curve for SPY. Trades are entered at the close (or optionally the next open for slightly better results). ✔️ 237 trades✔️ 1.8% average gain per trade✔️ 51% win rate✔️…
-
199,00 $
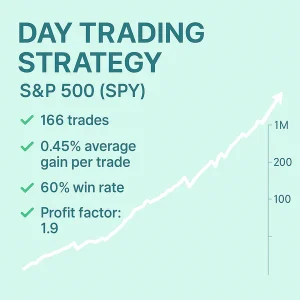
A short-term day trading strategy. Backtested on the SPY ETF with minimal market exposure and high risk-adjusted returns. ✔️ 166 trades✔️ 0.45% average gain per trade✔️ 60% win rate✔️ Profit factor: 1.9✔️ 2.3% annual return (CAGR)✔️ 2% market exposure✔️ Risk-adjusted return: 110%✔️ Max drawdown: -9% You’ll get the full trading rules – ready to test…
-
199,00 $
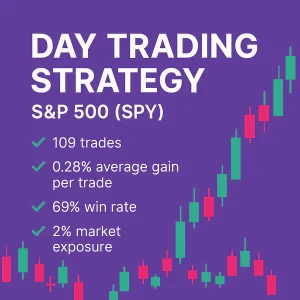
A short-only day trading strategy based on a seasonal pattern and one external indicator – backtested on the SPY ETF. It enters short at the open and covers at the close, with extremely low market exposure. ✔️ 109 trades✔️ 0.28% average gain per trade✔️ 69% win rate✔️ Profit factor: 2.5✔️ 1.3% annual return (CAGR)✔️ 2%…
-
199,00 $
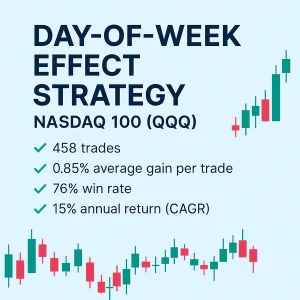
A short-term trading strategy that combines price action with the day-of-week effect – backtested on the QQQ ETF for strong consistency and statistical edge. ✔️ 458 trades✔️ 0.85% average gain per trade✔️ 76% win rate✔️ Profit factor: 2.7✔️ 15% annual return (CAGR)✔️ 25% market exposure✔️ Risk-adjusted return: 58%✔️ Max drawdown: -27% You’ll get the full…
-
199,00 $
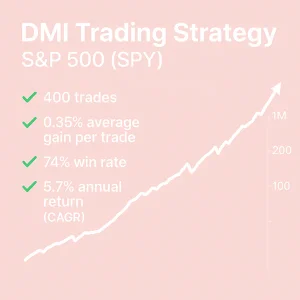
A swing trading strategy using the Directional Movement Index (DMI), combined with trend and mean reversion filters – backtested on the SPY ETF for high-accuracy trade setups. ✔️ 400 trades✔️ 0.35% average gain per trade✔️ 74% win rate✔️ Profit factor: 2✔️ 5.7% annual return (CAGR)✔️ 12% market exposure✔️ Risk-adjusted return: 34%✔️ Max drawdown: -17% You’ll…
-
199,00 $
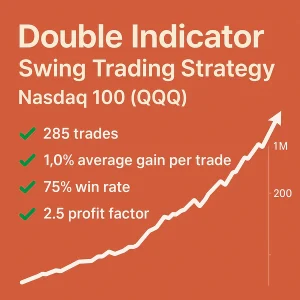
A backtested swing trading strategy using the often-overlooked ADX indicator, combined with a second signal filter. Tested on QQQ, the ETF tracking Nasdaq 100. ✅ 285 trades✅ 1.0% average gain per trade✅ 75% win rate✅ Profit factor: 2.5✅ 11% annual return (CAGR)✅ Only 17% market exposure✅ Risk-adjusted return: 66%✅ Max drawdown: -25% You’ll get the…
-
199,00 $
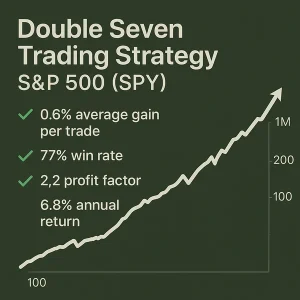
Inspired by Larry Connors’ classic Double Seven Strategy, this version uses modified parameters for improved results – backtested on the SPY ETF for consistent mean-reversion performance. ✔️ 370 trades✔️ 0.6% average gain per trade✔️ 77% win rate✔️ Profit factor: 2.2✔️ 6.8% annual return (CAGR)✔️ 28% market exposure✔️ Risk-adjusted return: 24%✔️ Max drawdown: -14% You’ll get…
-
199,00 $
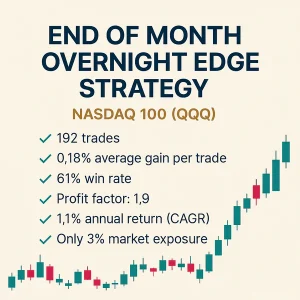
A backtested strategy that buys at the close and sells at the next open, regardless of conditions. Based on one simple variable and tested on QQQ – the ETF tracking Nasdaq 100. ✅ 192 trades✅ 0.18% average gain per trade✅ 61% win rate✅ Profit factor: 1.9✅ 1.1% annual return (CAGR)✅ Only 3% market exposure✅ Risk-adjusted…
-
199,00 $
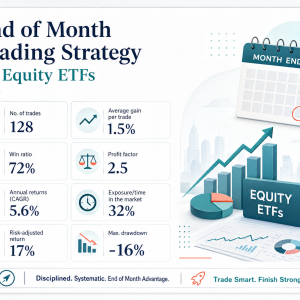
The strategy takes a position at the end of the month and holds it for one month. This strategy was our monthly Trading Edge for February 2026. 128 trades 1.5% average gain per trade 72% win rate Profit factor: 2.5 5.6% annual return (CAGR) 32% market exposure Risk-adjusted return: 17% Max drawdown: -16% You’ll get the…
-
199,00 $
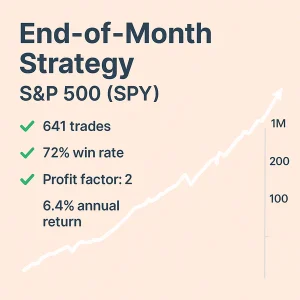
A swing trading strategy based on the well-known statistical end-of-month bias in equities – backtested on the SPY ETF for reliable, repeatable edge. This was our Monthly Trading Edge for June 2023 (Gold Members). ✔️ 641 trades✔️ 0.35% average gain per trade✔️ 72% win rate✔️ Profit factor: 2✔️ 6.4% annual return (CAGR)✔️ 21% market exposure✔️…
-
199,00 $
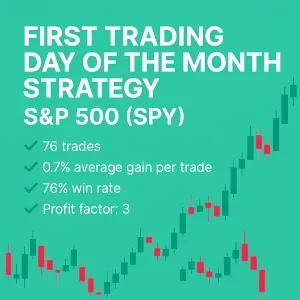
A seasonal trading strategy that captures the historically strong anomaly on the first trading day of the month – backtested on the SPY ETF for consistent edge with minimal exposure. ✔️ 76 trades✔️ 0.7% average gain per trade✔️ 76% win rate✔️ Profit factor: 3✔️ 1.7% annual return (CAGR)✔️ 2.4% market exposure✔️ Risk-adjusted return: 68%✔️ Max…
-
199,00 $
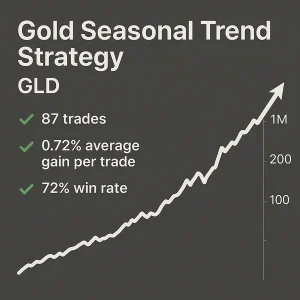
A seasonal swing trading strategy that targets a specific trading day when gold shows a strong historical trend – backtested on the GLD ETF for precision timing. ✔️ 87 trades✔️ 0.72% average gain per trade✔️ 72% win rate✔️ Profit factor: 3✔️ 3.1% annual return (CAGR)✔️ 4.1% market exposure✔️ Risk-adjusted return: 76%✔️ Max drawdown: -6% You’ll…
-
199,00 $
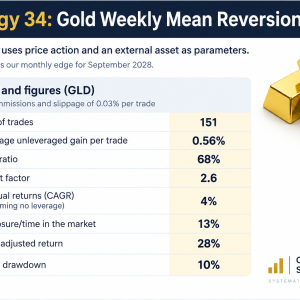
The strategy uses price action and an external asset as parameters. The strategy was our monthly edge for September 2026. 151 trades 0.56% average gain per trade 68% win rate Profit factor: 2.6 4% annual return (CAGR) 13% market exposure Risk-adjusted return: 28% Max drawdown: 10% You’ll get the full trading rules – ready to…
-
199,00 $
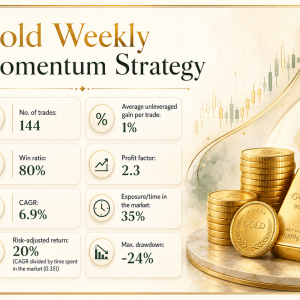
The strategy utilizes weekly bars and operates exclusively from the long side. The strategy was our monthly trading edge for October 2025. 144 trades 1% average gain per trade 80% win rate Profit factor: 2.3 6.9% annual return (CAGR) 35% market exposure Risk-adjusted return: 20% Max drawdown: -24% You’ll get the full trading rules –…
-
199,00 $
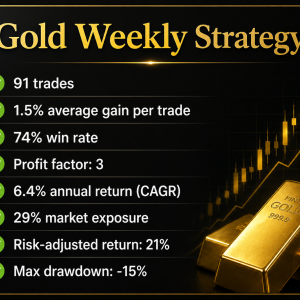
The strategy is based on weekly bars and is a mean reversion strategy. This strategy was our monthly Trading Edge for March 2026. 91 trades 1.5% average gain per trade 74% win rate Profit factor: 3 6.4% annual return (CAGR) 29% market exposure Risk-adjusted return: 21% Max drawdown: -15% You’ll get the full trading rules – ready to test and validate….
-
199,00 $
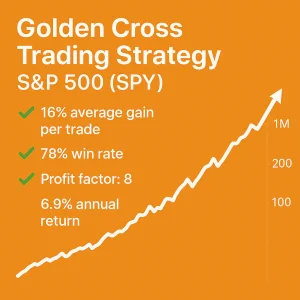
A classic trend-following strategy based on the Golden Cross indicator – historically effective across multiple markets and backtested here on the SPY ETF. ✔️ 33 trades✔️ 16% average gain per trade✔️ 78% win rate✔️ Profit factor: 8✔️ 6.9% annual return (CAGR)✔️ 70% market exposure✔️ Risk-adjusted return: 9.9%✔️ Max drawdown: -33% You’ll get the full trading…
-

199,00 $
A backtested swing trading strategy built on the IBS indicator with a smart twist. ✔️ 596 trades✔️ 0.77% average gain per trade✔️ 73% win rate✔️ Profit factor: 2.2✔️ 14.5% annual return (CAGR)✔️ Only 36% market exposure✔️ Risk-adjusted return: 40%✔️ Max drawdown: -22% You’ll get the full trading rules – ready to test and validate. We offer…
-
199,00 $
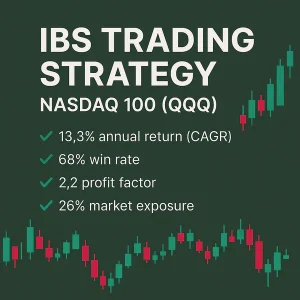
A swing trading strategy based on the Internal Bar Strength (IBS) indicator – backtested on the QQQ ETF and proven effective across other major stock ETFs as well. ✔️ 525 trades✔️ 0.65% average gain per trade✔️ 68% win rate✔️ Profit factor: 2.2✔️ 13.3% annual return (CAGR)✔️ 26% market exposure✔️ Risk-adjusted return: 50%✔️ Max drawdown: -41%…
-
199,00 $
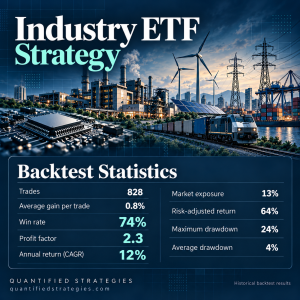
The strategy trades ten different ETFs: XLB, XLC, XLE, XLF, XLI, XLK, XLP, XLRE, XLV, and XLY. The trading rules, based on daily charts and next-day open entries, allow a maximum of 2 positions. The strategy was our monthly edge for October 2026. 828 trades 0.8% average gain per trade 74% win rate Profit factor:…
-
199,00 $
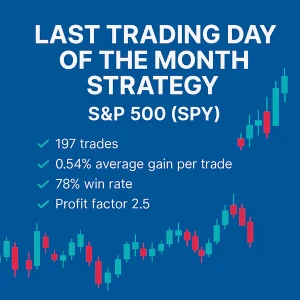
A seasonal swing trading strategy that enters on the last trading day of each month – backtested on the SPY ETF to capture a recurring end-of-month effect. ✔️ 197 trades✔️ 0.54% average gain per trade✔️ 78% win rate✔️ Profit factor: 2.5✔️ 3.4% annual return (CAGR)✔️ 6% market exposure✔️ Risk-adjusted return: 59%✔️ Max drawdown: -13% You’ll…
-
199,00 $
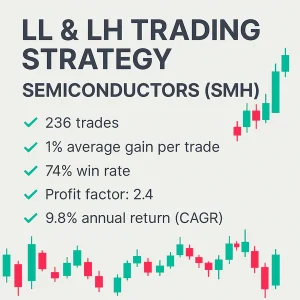
A mean reversion swing trading strategy built on the concept of lower lows and lower highs – backtested on the SMH ETF and also effective on QQQ and SPY. ✔️ 236 trades✔️ 1% average gain per trade✔️ 74% win rate✔️ Profit factor: 2.4✔️ 9.8% annual return (CAGR)✔️ 13% market exposure✔️ Risk-adjusted return: 73%✔️ Max drawdown:…
-
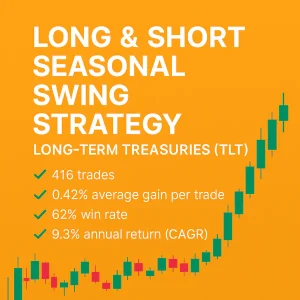
199,00 $
A backtested strategy combining both long and short seasonal setups. Entries occur at the close, with exits after a few days. Built for TLT – the ETF tracking long-term U.S. Treasury bonds. ✅ 416 trades✅ 0.42% average gain per trade✅ 62% win rate✅ Profit factor: 1.7✅ 9.3% annual return (CAGR)✅ 37% market exposure✅ Risk-adjusted return:…
-
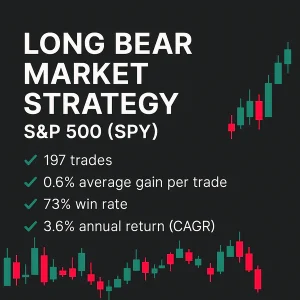
199,00 $
A long-only swing trading strategy designed specifically for bear markets. It trades selectively during market downturns and is backtested on the SPY ETF. This was our Monthly Trading Edge for March 2025 (Gold and Platinum Members). ✔️ 197 trades✔️ 0.6% average gain per trade✔️ 73% win rate✔️ Profit factor: 2✔️ 3.6% annual return (CAGR)✔️ 4%…
-
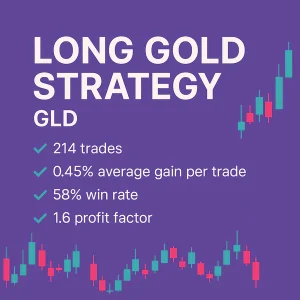
199,00 $
A long-only swing trading strategy for gold, entering and exiting at the close. Backtested on the GLD ETF for consistent performance. This was our Monthly Trading Edge for May 2025. ✔️ 214 trades✔️ 0.45% average gain per trade✔️ 58% win rate✔️ Profit factor: 1.6✔️ 4.5% annual return (CAGR)✔️ 21% market exposure✔️ Risk-adjusted return: 22%✔️ Max…
-
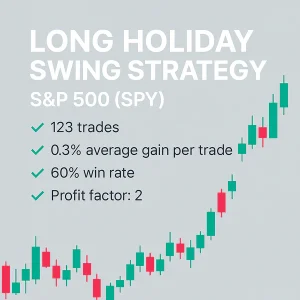
199,00 $
A backtested swing trading strategy that takes advantage of the market’s behavior around holidays – simple, effective, and built on historical S&P 500 (SPY) data. ✔️ 123 trades✔️ 0.3% average gain per trade✔️ 60% win rate✔️ Profit factor: 2✔️ 1.2% annual return (CAGR)✔️ Only 2% market exposure✔️ Risk-adjusted return: 60%✔️ Max drawdown: -7% You’ll get…
-
199,00 $
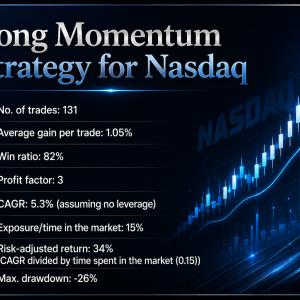
The strategy can be labeled a momentum strategy. It has two parameters to buy and one for when to sell. It’s based on daily bars. This strategy was our monthly Trading Edge for August 2025. 131 trades 1.05% average gain per trade 82% win rate Profit factor: 3 5.3% annual return (CAGR) 15% market exposure Risk-adjusted…
-
199,00 $
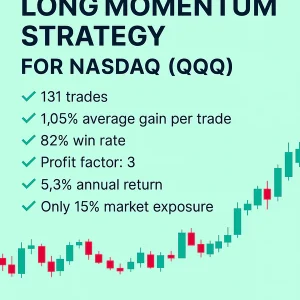
When the tech stocks start moving, they tend to gain momentum. This strategy is a momentum strategy – backtested on QQQ. ✅ 131 trades✅ 1.05% average gain per trade✅ 82% win rate✅ Profit factor: 3✅ 5.3% annual return (CAGR)✅ Only 15% market exposure✅ Risk-adjusted return: 34%✅ Max drawdown: -26% You’ll get the full trading rules…
-
199,00 $
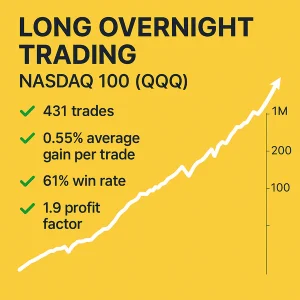
A backtested overnight strategy that enters at the close and exits at the close the next trading day. Built on two entry conditions and one exit. Tested on QQQ – the ETF tracking the Nasdaq 100. ✅ 431 trades✅ 0.55% average gain per trade✅ 61% win rate✅ Profit factor: 1.9✅ 9% annual return (CAGR)✅ Only…
-
199,00 $
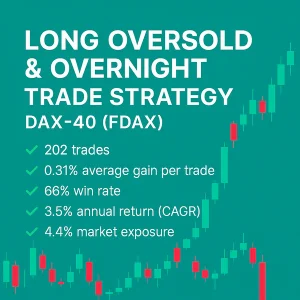
A backtested overnight swing trading strategy for the German DAX-40 index – buying the close and selling the next morning to capture short-term mean reversion. ✔️ 202 trades✔️ 0.31% average gain per trade✔️ 66% win rate✔️ Profit factor: 2.4✔️ 3.5% annual return (CAGR)✔️ 4.4% market exposure✔️ Max drawdown: -4% You’ll get the full trading rules…
-
199,00 $
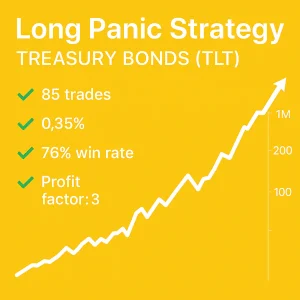
A short-term swing strategy designed to trade during market “panic” moments in the bond market – backtested on the TLT ETF with rare but high-probability entries. ✔️ 85 trades✔️ 0.35% average gain per trade✔️ 76% win rate✔️ Profit factor: 3✔️ 1.3% annual return (CAGR)✔️ 2.5% market exposure✔️ Risk-adjusted return: 52%✔️ Max drawdown: -2.7% You’ll get…
-
199,00 $
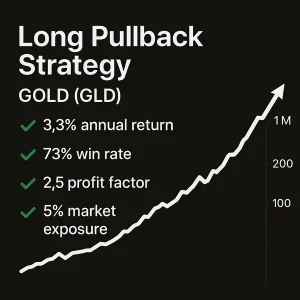
A swing trading strategy designed to capture short-term pullbacks in gold, with entries and exits at the close. Backtested on the GLD ETF and also effective on major stock indices like SPY and QQQ. This was our Monthly Trading Edge for February 2025. ✔️ 90 trades✔️ 0.75% average gain per trade✔️ 73% win rate✔️ Profit…
-
199,00 $
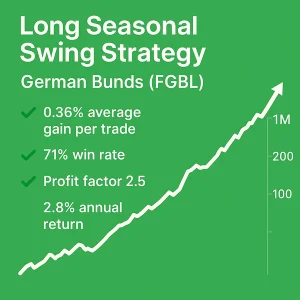
A backtested seasonal swing trading strategy built specifically for the German Bunds (FGBL) – designed to exploit recurring patterns in one of Europe’s most liquid bond markets. ✔️ 179 trades✔️ 0.36% average gain per trade✔️ 71% win rate✔️ Profit factor: 2.5✔️ 2.8% annual return (CAGR)✔️ 15% market exposure✔️ Max drawdown: -5% You’ll get the full…
-
199,00 $
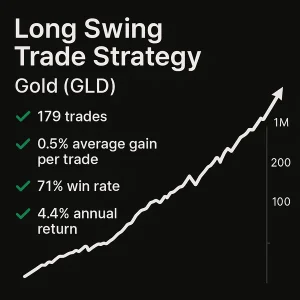
A backtested swing trading strategy built for gold – designed to capture short-term edges in a notoriously difficult market using the GLD ETF. ✔️ 179 trades✔️ 0.5% average gain per trade✔️ 71% win rate✔️ Profit factor: 2.1✔️ 4.4% annual return (CAGR)✔️ 10% market exposure✔️ Risk-adjusted return: 42%✔️ Max drawdown: -14% You’ll get the full trading…
-
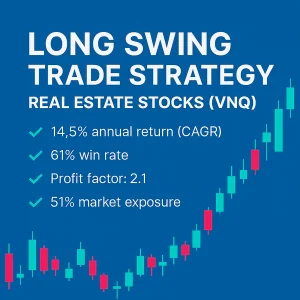
199,00 $
A backtested swing trading strategy designed for the real estate sector – built on the VNQ ETF and optimized for strong, risk-adjusted returns. ✔️ 375 trades✔️ 0.82% average gain per trade✔️ 61% win rate✔️ Profit factor: 2.1✔️ 14.5% annual return (CAGR)✔️ 51% market exposure✔️ Risk-adjusted return: 28%✔️ Max drawdown: -33% You’ll get the full trading…
-
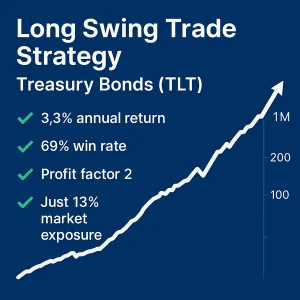
199,00 $
A backtested swing trading strategy tailored for the U.S. Treasury bond market – built on the TLT ETF to deliver solid performance with minimal market exposure. ✔️ 242 trades✔️ 0.31% average gain per trade✔️ 69% win rate✔️ Profit factor: 2✔️ 3.3% annual return (CAGR)✔️ 13% market exposure✔️ Risk-adjusted return: 24%✔️ Max drawdown: -9% You’ll get…
-
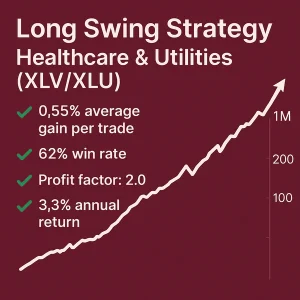
199,00 $
A seasonal swing trading strategy built for XLV and XLU ETFs. Uses three entry conditions and two for exit. Trades enter at the open and exit after 4–5 days on average. ✅ 160 trades✅ 0.55% average gain per trade✅ 62% win rate✅ Profit factor: 2.0✅ 3.3% annual return (CAGR)✅ 9% market exposure✅ Risk-adjusted return: 34%✅…
-
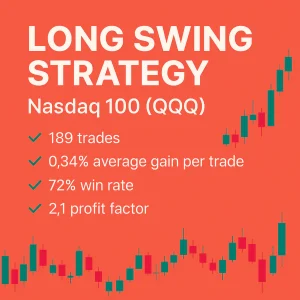
199,00 $
A backtested swing trading strategy using three entry variables and one for exit. Entry is at the close and exit takes place one or more trading days later. Built on QQQ – the ETF tracking the Nasdaq 100. ✅ 189 trades✅ 0.75% average gain per trade✅ 72% win rate✅ Profit factor: 2.1✅ 6.0% annual return…
-
199,00 $
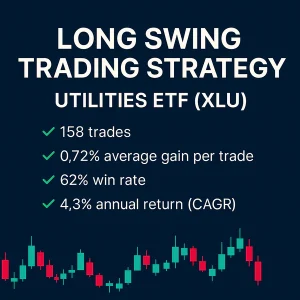
A backtested swing trading strategy with two entry/exit variables, designed for XLU – the ETF tracking U.S. utilities. Ideal for those looking to capture moves in a traditionally defensive sector. ✅ 158 trades✅ 0.72% average gain per trade✅ 62% win rate✅ Profit factor: 1.9✅ 4.3% annual return (CAGR)✅ 14% market exposure✅ Risk-adjusted return: 30%✅ Max…
-
199,00 $
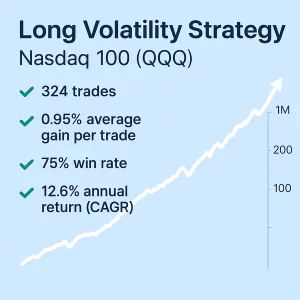
A backtested swing strategy designed to capitalize on volatility in QQQ – the ETF tracking the Nasdaq 100. Built with robust logic and tested with slippage and commission included. ✅ 324 trades✅ 0.95% average gain per trade✅ 75% win rate✅ Profit factor: 2.3✅ 12.6% annual return (CAGR)✅ 20% market exposure✅ Risk-adjusted return: 62%✅ Max drawdown:…
-
199,00 $
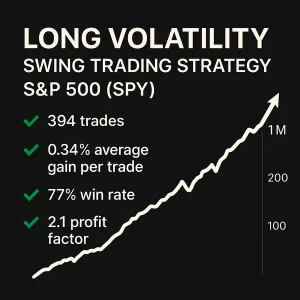
A backtested long-volatility strategy built for SPY – the ETF tracking the S&P 500. The strategy enters on strong close days (often with high RSI) and exits based on one defined variable. ✅ 394 trades✅ 0.34% average gain per trade✅ 77% win rate✅ Profit factor: 2.1✅ 4.1% annual return (CAGR)✅ 10% market exposure✅ Risk-adjusted return:…
-
199,00 $
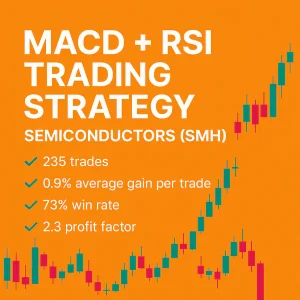
A short-term swing trading strategy combining MACD and RSI indicators – backtested on the SMH ETF. Built for multi-day trades, with strong performance and improved results when paired with a trend filter (not included). ✔️ 235 trades✔️ 0.9% average gain per trade✔️ 73% win rate✔️ Profit factor: 2.3✔️ 8% annual return (CAGR)✔️ 14% market exposure✔️…
-
199,00 $
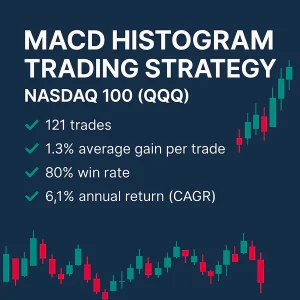
A backtested short-term trading strategy built on the MACD histogram – optimized for high precision and tested on the QQQ ETF tracking the Nasdaq 100. ✔️ 121 trades✔️ 1.3% average gain per trade✔️ 80% win rate✔️ Profit factor: 4.5✔️ 6.1% annual return (CAGR)✔️ 6% market exposure✔️ Risk-adjusted return: 103%✔️ Max drawdown: -20% You’ll get the…
-
199,00 $
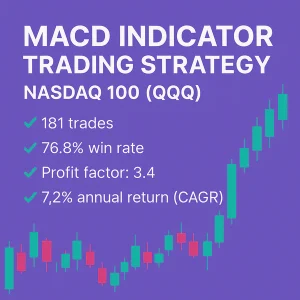
A refined swing trading strategy based on the MACD indicator – implemented with a creative twist and backtested on the QQQ ETF that tracks the Nasdaq 100. ✔️ 181 trades✔️ 1.01% average gain per trade✔️ 76.8% win rate✔️ Profit factor: 3.4✔️ 7.2% annual return (CAGR)✔️ 8.86% market exposure✔️ Risk-adjusted return: 81.31%✔️ Max drawdown: -11.15% You’ll…
-
199,00 $
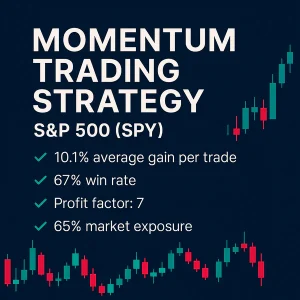
A flexible momentum-based strategy designed for both stocks and crypto – backtested here on the SPY ETF tracking the S&P 500 for long-term trend participation. ✔️ 43 trades✔️ 10.1% average gain per trade✔️ 67% win rate✔️ Profit factor: 7✔️ 5.9% annual return (CAGR)✔️ 65% market exposure✔️ Risk-adjusted return: 9%✔️ Max drawdown: -25% You’ll get the…
-
199,00 $
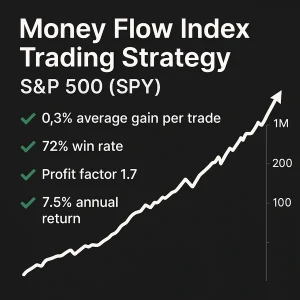
A backtested swing trading strategy built around the Money Flow Index (MFI) – a momentum indicator that combines price and volume to identify overbought and oversold conditions on the SPY ETF. ✔️ 895 trades✔️ 0.3% average gain per trade✔️ 72% win rate✔️ Profit factor: 1.7✔️ 7.5% annual return (CAGR)✔️ 28% market exposure✔️ Risk-adjusted return: 26%✔️…
-
199,00 $
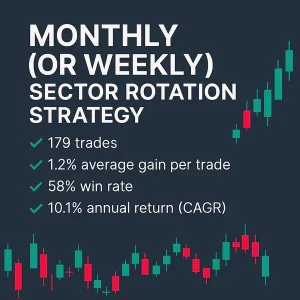
A rotation-based strategy that shifts between U.S. stocks (SPY), international stocks (EFA), gold (GLD), and bonds (TLT) – trading either weekly (Fridays) or monthly. Comes with rules in plain-English and Amibroker code. ✔️ 179 trades✔️ 1.2% average gain per trade✔️ 58% win rate✔️ Profit factor: 1.9✔️ 10.1% annual return (CAGR)✔️ 100% market exposure✔️ Risk-adjusted return:…
-
199,00 $
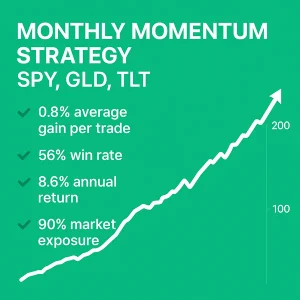
A rotation-based momentum strategy that shifts monthly between stocks (SPY), gold (GLD), and bonds (TLT) – designed for broad asset class exposure, though rotation strategies can be fragile over time. ✔️ 476 trades✔️ 0.8% average gain per trade✔️ 56% win rate✔️ Profit factor: 1.4✔️ 8.6% annual return (CAGR)✔️ 90% market exposure✔️ Risk-adjusted return: 9.5%✔️ Max…
-
199,00 $
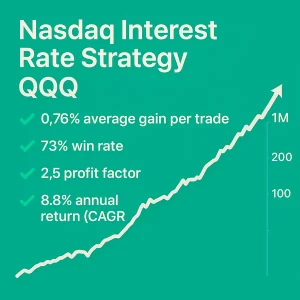
A swing trading strategy driven by interest rate levels – entering positions at the open following a signal. Backtested on the QQQ ETF tracking the Nasdaq 100. ✔️ 264 trades✔️ 0.76% average gain per trade✔️ 73% win rate✔️ Profit factor: 2.5✔️ 8.8% annual return (CAGR)✔️ 16% market exposure✔️ Risk-adjusted return: 55%✔️ Max drawdown: -19% You’ll…
-
199,00 $
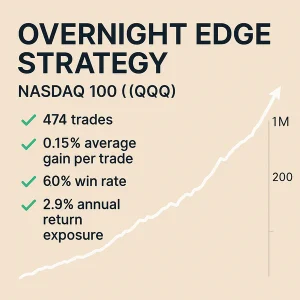
A backtested swing trading strategy that buys at the close and sells at the next open. Built on two key variables and tested on QQQ, the ETF tracking the Nasdaq 100. ✅ 474 trades✅ 0.15% average gain per trade✅ 60% win rate✅ Profit factor: 1.5✅ 2.9% annual return (CAGR)✅ Only 7.3% market exposure✅ Risk-adjusted return:…
-
199,00 $
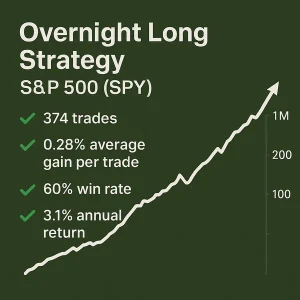
A backtested swing trading strategy that enters at the close and exits at the close of the next day. Built using three variables for entry and one for exit, tested on SPY – the ETF tracking the S&P 500. ✅ 374 trades✅ 0.28% average gain per trade✅ 60% win rate✅ Profit factor: 1.6✅ 3.1% annual…
-
199,00 $
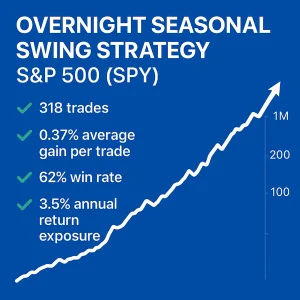
A backtested seasonal swing trading strategy with three entry variables and one exit rule. It enters at the open and exits at the close the following day. Tested on SPY – the ETF tracking the S&P 500. ✅ 318 trades✅ 0.37% average gain per trade✅ 62% win rate✅ Profit factor: 2.0✅ 3.5% annual return (CAGR)✅…
-
199,00 $
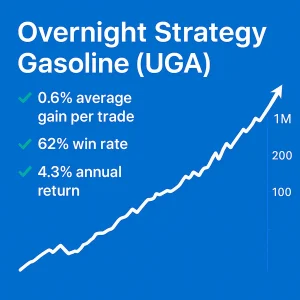
A short-term overnight trading strategy for the gasoline market, built on a seasonal pattern and two external indicators. It enters at the close and exits at the following day’s close. Backtested on the UGA ETF and potentially applicable to gasoline futures contracts. This was our Monthly Trading Edge for November 2024. ✔️ 123 trades✔️ 0.6%…
-
199,00 $
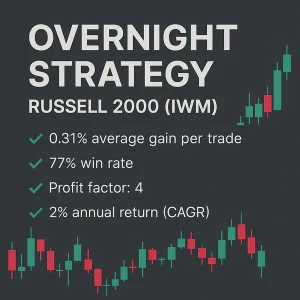
A short-term overnight trading strategy that enters at the close and exits at the next day’s open – backtested on the IWM ETF for quick, low-exposure gains. This was our Trading Edge for February 2024. ✔️ 152 trades✔️ 0.31% average gain per trade✔️ 77% win rate✔️ Profit factor: 4✔️ 2% annual return (CAGR)✔️ 2.5% market…
-
199,00 $
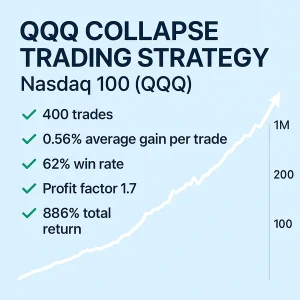
A backtested short-term strategy that enters at the open and exits at the close, based on two simple criteria. Designed for QQQ – the ETF tracking the Nasdaq 100. ✅ 400 trades✅ 0.56% average gain per trade✅ 62% win rate✅ Profit factor: 1.7✅ 886% total return (CAGR)✅ Only 10% market exposure✅ Risk-adjusted return: 80%✅ Max…
-
199,00 $
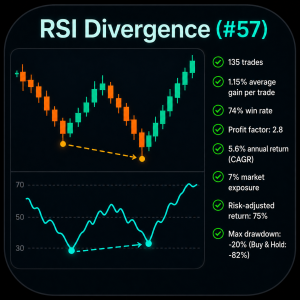
This RSI divergence strategy complements other mean-reversion RSI strategies (because its logic is slightly different). This strategy complements other mean reversion strategies because the logic is slightly different. Published early 2022, and again as the trading edge for June 2026. ✔️ 135 trades✔️ 1.15% average gain per trade✔️ 74% win rate✔️ Profit factor: 2.8✔️ 5.6%…
-
199,00 $
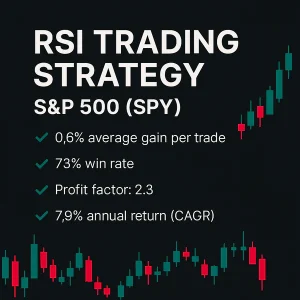
A backtested short-term swing trading strategy built on the classic RSI indicator – tested on the S&P 500 through the SPY ETF and designed for consistent, low-exposure performance. ✔️ 402 trades✔️ 0.6% average gain per trade✔️ 73% win rate✔️ Profit factor: 2.3✔️ 7.9% annual return (CAGR)✔️ 13% market exposure✔️ Risk-adjusted return: 57%✔️ Max drawdown: -16%…
-
199,00 $
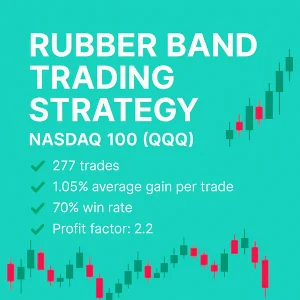
A mean reversion strategy built for fast and volatile markets – backtested on the QQQ ETF tracking the Nasdaq 100, ideal for snapping back after sharp moves. ✔️ 277 trades✔️ 1.05% average gain per trade✔️ 70% win rate✔️ Profit factor: 2.2✔️ 11.2% annual return (CAGR)✔️ 16% market exposure✔️ Risk-adjusted return: 68%✔️ Max drawdown: -23% You’ll…
-
199,00 $
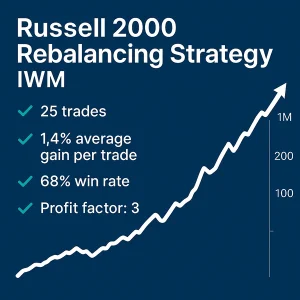
An annual seasonal trading strategy that capitalizes on the rebalancing effect in the Russell 2000 index – backtested on the IWM ETF and futures data. ✔️ 25 trades✔️ 1.4% average gain per trade✔️ 68% win rate✔️ Profit factor: 3✔️ 1.4% annual return (CAGR)✔️ 2% market exposure✔️ Risk-adjusted return: 69%✔️ Max drawdown: -6% You’ll get the…
-
199,00 $
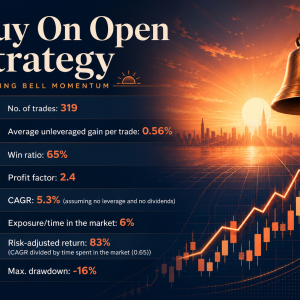
The strategy buys the open and holds for at least one day. Backtested on the ETF that tracks the S&P 500 (SPY). Work well for QQQ and XLK. This was our trading edge for April 2026. 319 trades 0.55% average gain per trade 65% win rate Profit factor: 2.4 5.3% annual return (CAGR) 6% market…
-
199,00 $
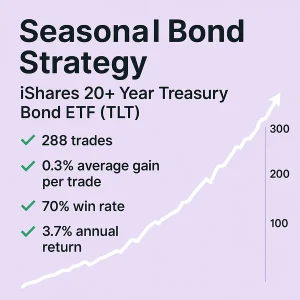
A backtested swing trading strategy based on seasonality, combined with two simple price-based filters. Built and tested on TLT – the ETF tracking long-term U.S. Treasury bonds. This strategy was our monthly Trading Edge for June 2021. ✅ 288 trades✅ 0.3% average gain per trade✅ 70% win rate✅ Profit factor: 1.8✅ 3.7% annual return (CAGR)✅…
-
199,00 $
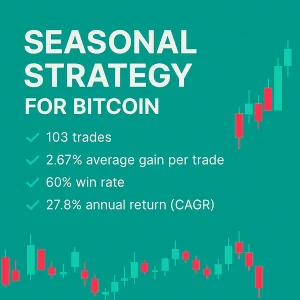
The strategy is based on a day-of-the-week pattern. Certain days exhibit stronger bullish tendencies in BTC-USD. The system identifies and trades only those days, creating a simple yet effective edge. All trades are entered at the close and held for a few days. No leverage or shorting is used. ✅ 103 trades✅ 2.67% average gain…
-
199,00 $
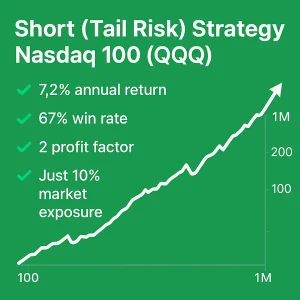
A tactical short strategy designed to perform during periods of high volatility in the Nasdaq 100. It trades infrequently and may bleed during bull markets, but has historically delivered strong tail-risk protection. This was our Monthly Trading Edge for July 2023 (Gold Members). ✔️ 156 trades✔️ 1.2% average gain per trade✔️ 67% win rate✔️ Profit…
-
199,00 $
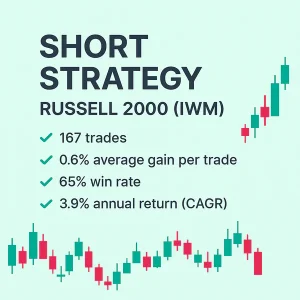
A short-only swing trading strategy backtested on the IWM ETF tracking the Russell 2000 index – designed to capitalize on market pullbacks with minimal exposure. This was our monthly trading edge for April 2024. ✔️ 167 trades✔️ 0.6% average gain per trade✔️ 65% win rate✔️ Profit factor: 2.3✔️ 3.9% annual return (CAGR)✔️ 4% market exposure✔️…
-
199,00 $
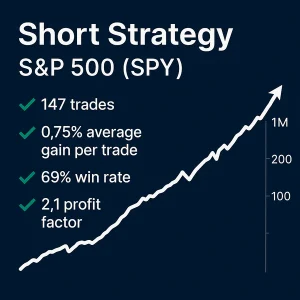
A short-only swing trading strategy that enters and exits at the close. Backtested primarily on the SPY ETF, where it has shown the most consistent results—but it has also performed well on QQQ and SMH. This was our Monthly Trading Edge for January 2025. ✔️ 147 trades✔️ 0.75% average gain per trade✔️ 69% win rate✔️…
-
199,00 $
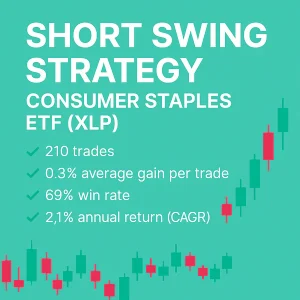
A backtested short swing trading strategy built for XLP – the ETF tracking consumer staples. Uses five entry variables and two for exit. The average holding time is 2.7 days. ✅ 210 trades✅ 0.3% average gain per trade✅ 69% win rate✅ Profit factor: 2.1✅ 2.1% annual return (CAGR)✅ Only 6% market exposure✅ Risk-adjusted return: 36%✅…
-
199,00 $
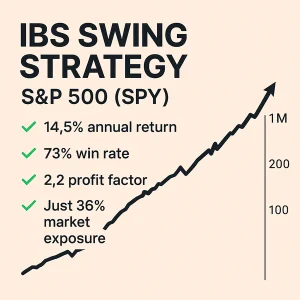
A backtested swing trading strategy using two simple variables for short entries, with fixed holding periods. Built and tested on TLT – the ETF tracking long-duration U.S. Treasury bonds. This is a SHORT strategy. ✅ 211 trades✅ 0.47% average gain per trade✅ 12% win rate✅ Profit factor: 1.8✅ 4.3% annual return (CAGR)✅ 26% market exposure✅…
-
199,00 $
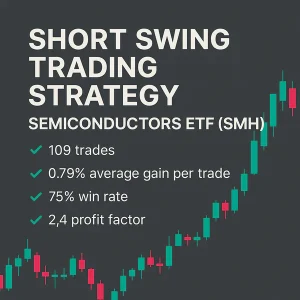
A backtested short swing trading strategy using two variables for both entry and short covering. Built for SMH – the ETF tracking the semiconductor sector. Also performs well on SPY and IWM. This is a SHORT strategy. ✅ 109 trades✅ 0.79% average gain per trade✅ 75% win rate✅ Profit factor: 2.4✅ 3.5% annual return (CAGR)✅…
-
199,00 $
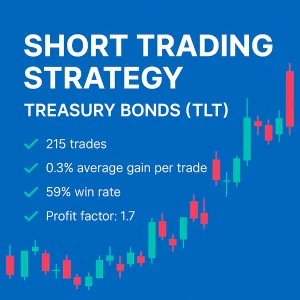
A short-only swing strategy for the bond market, built with three entry variables and one for exit. It enters at the open and exits at a future close. Backtested on the TLT ETF and optimized for tactical bond market pullbacks. This was our Monthly Trading Edge for August 2023 (Gold Members). ✔️ 215 trades✔️ 0.3%…
-
199,00 $
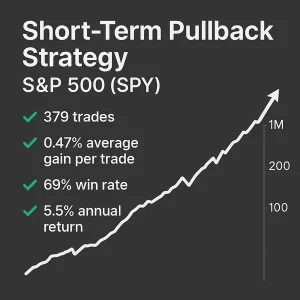
A swing trading strategy designed to exploit pullbacks from recent highs – backtested on the SPY ETF to capture short-term reversals in strong markets. ✔️ 379 trades✔️ 0.47% average gain per trade✔️ 69% win rate✔️ Profit factor: 2.52✔️ 5.5% annual return (CAGR)✔️ 14% market exposure✔️ Risk-adjusted return: 39%✔️ Max drawdown: -14% You’ll get the full…
-
199,00 $
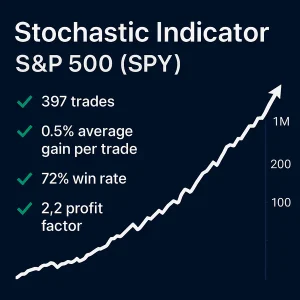
A backtested short-term trading strategy based on the Stochastic indicator – tested on the SPY ETF to identify high-probability setups with minimal market exposure. ✔️ 397 trades✔️ 0.5% average gain per trade✔️ 72% win rate✔️ Profit factor: 2.2✔️ 6.2% annual return (CAGR)✔️ 13% market exposure✔️ Risk-adjusted return: 47%✔️ Max drawdown: -20% You’ll get the full…
-
199,00 $
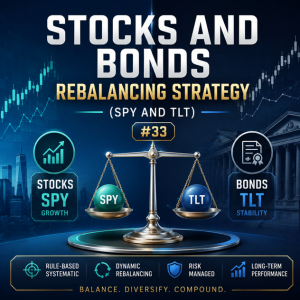
The strategy takes advantage of imbalances in the 60/40 stock-and-bond allocation. This strategy was our monthly Trading Edge for August 2026. 280 trades 0.85% average gain per trade 65% win rate Profit factor: 3 10.4% annual return (CAGR) 32% market exposure Risk-adjusted return: 32% Max drawdown: -23% You’ll get the full trading rules – ready to…
-
199,00 $
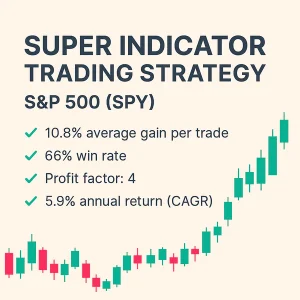
A weekly trend-following strategy built on the SuperTrend indicator – backtested on the SPY ETF to capture sustained momentum with clarity and simplicity. ✔️ 39 trades✔️ 10.8% average gain per trade✔️ 66% win rate✔️ Profit factor: 4✔️ 5.9% annual return (CAGR)✔️ 62% market exposure✔️ Risk-adjusted return: 9.5%✔️ Max drawdown: -24% You’ll get the full trading…
-
199,00 $
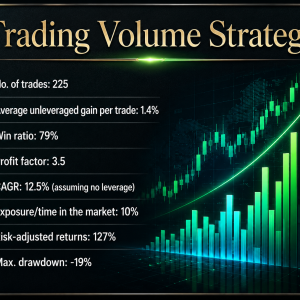
The strategy uses volume as one of the parameters. The strategy buys the next open after the signal. This strategy was our monthly Trading Edge for January 2026. 225 trades 1.4% average gain per trade 79% win rate Profit factor: 3.5 12.5% annual return (CAGR) 10% market exposure Risk-adjusted return: 127% Max drawdown: -19% You’ll…
-
199,00 $
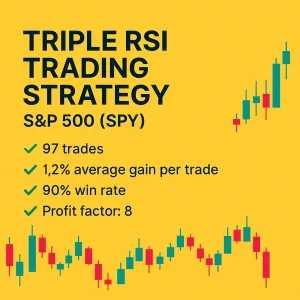
A short-term swing trading strategy that combines three RSI variations with a trend filter – backtested on the SPY ETF for high-accuracy entries during pullbacks. ✔️ 97 trades✔️ 1.2% average gain per trade✔️ 90% win rate✔️ Profit factor: 8✔️ 3.8% annual return (CAGR)✔️ 5% market exposure✔️ Risk-adjusted return: 69%✔️ Max drawdown: -13% You’ll get the…
-
199,00 $
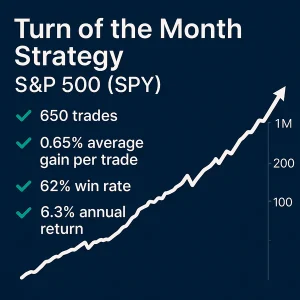
A swing trading strategy based on the well-documented turn-of-the-month effect – backtested on the SPY ETF and the S&P 500 cash index going back to 1960. This was our Monthly Trading Edge for September 2023. ✔️ 650 trades✔️ 0.65% average gain per trade✔️ 62% win rate✔️ Profit factor: 2✔️ 6.3% annual return (CAGR)✔️ 24% market…
-
199,00 $
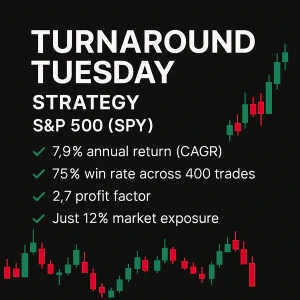
A short-term swing trading strategy based on the well-known Turnaround Tuesday market bias – backtested on the SPY ETF with strong win rate and low exposure. ✔️ 400 trades✔️ 0.65% average gain per trade✔️ 75% win rate✔️ Profit factor: 2.7✔️ 7.9% annual return (CAGR)✔️ 12% market exposure✔️ Risk-adjusted return: 63%✔️ Max drawdown: -18% You’ll get…
-
199,00 $
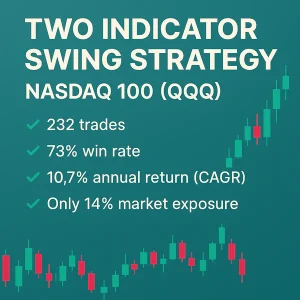
A backtested swing trading strategy using the popular IBS indicator combined with a second filter – built to enhance performance on the Nasdaq 100 ETF (QQQ). ✅ 232 trades✅ 1.2% average gain per trade✅ 73% win rate✅ Profit factor: 2.7✅ 10.7% annual return (CAGR)✅ Only 14% market exposure✅ Risk-adjusted return: 76%✅ Max drawdown: -19% You’ll…
-
199,00 $
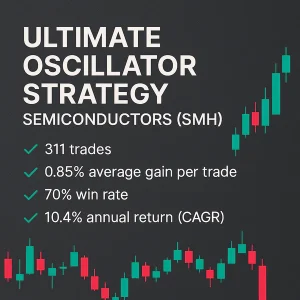
A swing trading strategy built on the Ultimate Oscillator – backtested on the SMH ETF and evaluated across various markets including stocks (S&P 500) and bonds (TLT). ✔️ 311 trades✔️ 0.85% average gain per trade✔️ 70% win rate✔️ Profit factor: 2.2✔️ 10.4% annual return (CAGR)✔️ 20% market exposure✔️ Risk-adjusted return: 50%✔️ Max drawdown: -46% You’ll…
-
199,00 $
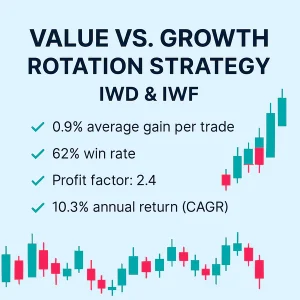
A long-only rotation strategy that shifts weekly between value (IWD) and growth (IWF) ETFs – based on end-of-week signals. Built for trend participation, though rotation strategies may degrade over time. ✔️ 288 trades✔️ 0.9% average gain per trade✔️ 62% win rate✔️ Profit factor: 2.4✔️ 10.3% annual return (CAGR)✔️ 69% market exposure✔️ Risk-adjusted return: 10.3%✔️ Max…
-

199,00 $
A backtested swing trading strategy built on volatility bands. ✔️ 189 trades✔️ 1.6% average gain per trade✔️ 80% win rate✔️ Profit factor: 3.1✔️ 12.1% annual return (CAGR)✔️ Only 11% market exposure✔️ Risk-adjusted return: 110%✔️ Max drawdown: -19.5% You’ll get the full trading rules – ready to test and validate. We offer full trading code in TradingView/Python, Amibroker, Tradestation, and NinjaTrader. If your code…
-

199,00 $
A backtested swing trading strategy using the Williams %R indicator, enhanced with a second custom filter, applied on QQQ – the ETF tracking the Nasdaq 100. ✅ 255 trades✅ 1.13% average gain per trade✅ 75.7% win rate✅ Profit factor: 2.88✅ 11.4% annual return (CAGR)✅ Only 14.1% market exposure✅ Risk-adjusted return: 81.2%✅ Max drawdown: -20.8% You’ll get the full trading rules – ready to…
-
199,00 $
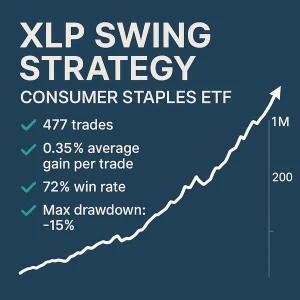
A backtested swing trading strategy developed for XLP – the ETF tracking consumer staples like Walmart, Procter & Gamble, and more. Its behavior differs from broad stock indices, offering diversification. ✅ 477 trades✅ 0.35% average gain per trade✅ 72% win rate✅ Profit factor: 1.8✅ 8.1% annual return (CAGR)✅ 32% market exposure✅ Risk-adjusted return: 20%✅ Max…
-
199,00 $
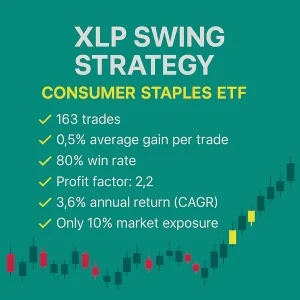
A backtested swing trading strategy designed for XLP – the ETF tracking consumer staples like Walmart and Procter & Gamble. Built on two variables, this strategy offers diversification compared to broader indices. ✅ 163 trades✅ 0.5% average gain per trade✅ 80% win rate✅ Profit factor: 2.2✅ 3.6% annual return (CAGR)✅ Only 10% market exposure✅ Risk-adjusted…
