-

199,00 $
We compiled 6 Larry Connors strategies into a single product at the price of one strategy. We added a variable. Backtested on the ETF that tracks the S&P 500 (SPY). The strategy has code for Amibroker and Tradestation/Easy Langauge. Published in autumn 2021.
-
199,00 $
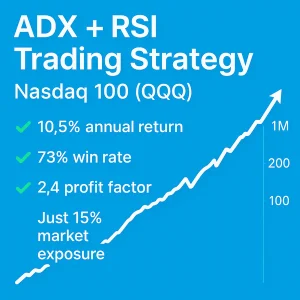
A swing trading strategy combining ADX and RSI indicators for precision entries in trending conditions – backtested on the QQQ ETF tracking the Nasdaq 100. ✔️ 258 trades✔️ 1% average gain per trade✔️ 73% win rate✔️ Profit factor: 2.4✔️ 10.5% annual return (CAGR)✔️ 15% market exposure✔️ Risk-adjusted return: 70%✔️ Max drawdown: -23% You’ll get the…
-
199,00 $
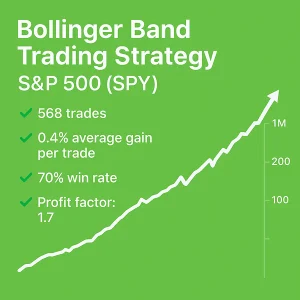
A backtested short-term swing trading strategy built on Bollinger Bands – designed to capture volatility compression and expansion on the SPY ETF tracking the S&P 500. ✔️ 568 trades✔️ 0.4% average gain per trade✔️ 70% win rate✔️ Profit factor: 1.7✔️ 6.5% annual return (CAGR)✔️ 20% market exposure✔️ Risk-adjusted return: 16%✔️ Max drawdown: -18% You’ll get…
-
199,00 $
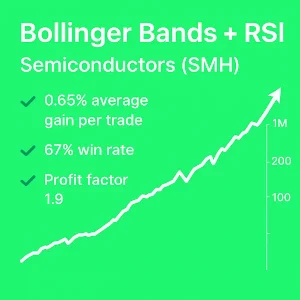
A long/short swing trading strategy combining Bollinger Bands and RSI – backtested on the SMH ETF tracking the semiconductor sector for robust, data-driven signals. ✔️ 297 trades✔️ 0.65% average gain per trade✔️ 67% win rate✔️ Profit factor: 1.9✔️ 8.3% annual return (CAGR)✔️ 16% market exposure✔️ Risk-adjusted return: 51%✔️ Max drawdown: -13% You’ll get the full…
-
199,00 $
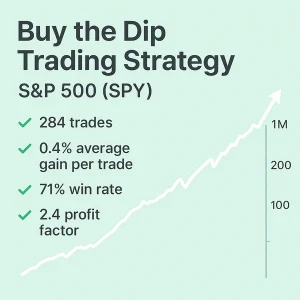
A mean reversion swing strategy that capitalizes on pullbacks during long-term bullish trends – backtested on the SPY ETF tracking the S&P 500. ✔️ 284 trades✔️ 0.4% average gain per trade✔️ 71% win rate✔️ Profit factor: 2.4✔️ 3.4% annual return (CAGR)✔️ 9% market exposure✔️ Risk-adjusted return: 34%✔️ Max drawdown: -14% You’ll get the full trading…
-
199,00 $
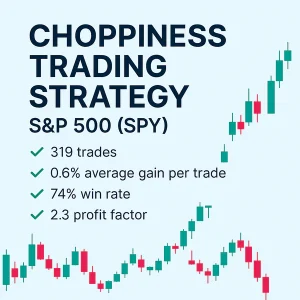
A swing trading strategy partially based on the Choppiness Index – designed to detect and adapt to choppy versus trending conditions. Backtested on the SPY ETF for consistent short-term performance. ✔️ 319 trades✔️ 0.6% average gain per trade✔️ 74% win rate✔️ Profit factor: 2.3✔️ 5.5% annual return (CAGR)✔️ 10% market exposure✔️ Risk-adjusted return: 55%✔️ Max…
-
199,00 $
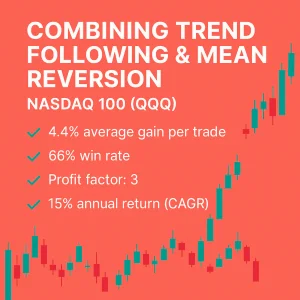
This strategy blends two complementary approaches—trend following and mean reversion—into one robust system. Backtested on the QQQ ETF, it demonstrates how combining different edges can enhance performance and reduce risk. ✔️ 99 trades✔️ 4.4% average gain per trade✔️ 66% win rate✔️ Profit factor: 3✔️ 15% annual return (CAGR)✔️ 72% market exposure✔️ Risk-adjusted return: 21%✔️ Max…
-
199,00 $
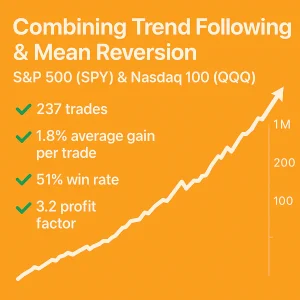
A hybrid strategy that combines a long-term trend-following approach with a short-term mean reversion component. Backtested on both SPY and QQQ ETFs, with a stronger equity curve for SPY. Trades are entered at the close (or optionally the next open for slightly better results). ✔️ 237 trades✔️ 1.8% average gain per trade✔️ 51% win rate✔️…
-
199,00 $
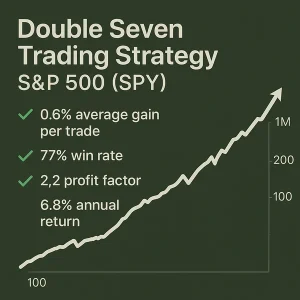
Inspired by Larry Connors’ classic Double Seven Strategy, this version uses modified parameters for improved results – backtested on the SPY ETF for consistent mean-reversion performance. ✔️ 370 trades✔️ 0.6% average gain per trade✔️ 77% win rate✔️ Profit factor: 2.2✔️ 6.8% annual return (CAGR)✔️ 28% market exposure✔️ Risk-adjusted return: 24%✔️ Max drawdown: -14% You’ll get…
-
199,00 $
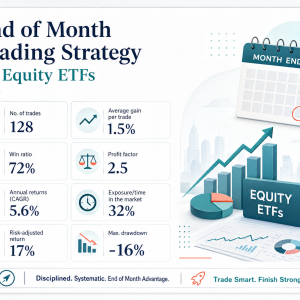
The strategy takes a position at the end of the month and holds it for one month. This strategy was our monthly Trading Edge for February 2026. 128 trades 1.5% average gain per trade 72% win rate Profit factor: 2.5 5.6% annual return (CAGR) 32% market exposure Risk-adjusted return: 17% Max drawdown: -16% You’ll get the…
-
199,00 $
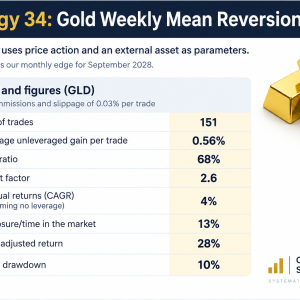
The strategy uses price action and an external asset as parameters. The strategy was our monthly edge for September 2026. 151 trades 0.56% average gain per trade 68% win rate Profit factor: 2.6 4% annual return (CAGR) 13% market exposure Risk-adjusted return: 28% Max drawdown: 10% You’ll get the full trading rules – ready to…
-
199,00 $
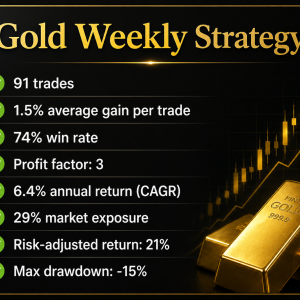
The strategy is based on weekly bars and is a mean reversion strategy. This strategy was our monthly Trading Edge for March 2026. 91 trades 1.5% average gain per trade 74% win rate Profit factor: 3 6.4% annual return (CAGR) 29% market exposure Risk-adjusted return: 21% Max drawdown: -15% You’ll get the full trading rules – ready to test and validate….
-
199,00 $
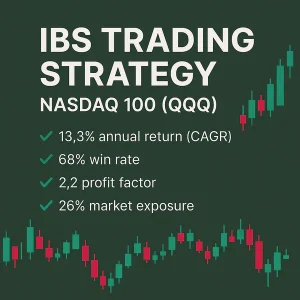
A swing trading strategy based on the Internal Bar Strength (IBS) indicator – backtested on the QQQ ETF and proven effective across other major stock ETFs as well. ✔️ 525 trades✔️ 0.65% average gain per trade✔️ 68% win rate✔️ Profit factor: 2.2✔️ 13.3% annual return (CAGR)✔️ 26% market exposure✔️ Risk-adjusted return: 50%✔️ Max drawdown: -41%…
-
199,00 $
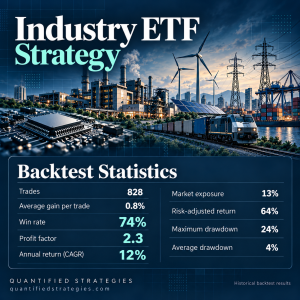
The strategy trades ten different ETFs: XLB, XLC, XLE, XLF, XLI, XLK, XLP, XLRE, XLV, and XLY. The trading rules, based on daily charts and next-day open entries, allow a maximum of 2 positions. The strategy was our monthly edge for October 2026. 828 trades 0.8% average gain per trade 74% win rate Profit factor:…
-
199,00 $
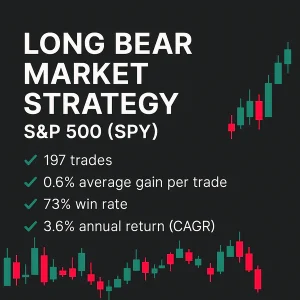
A long-only swing trading strategy designed specifically for bear markets. It trades selectively during market downturns and is backtested on the SPY ETF. This was our Monthly Trading Edge for March 2025 (Gold and Platinum Members). ✔️ 197 trades✔️ 0.6% average gain per trade✔️ 73% win rate✔️ Profit factor: 2✔️ 3.6% annual return (CAGR)✔️ 4%…
-
199,00 $
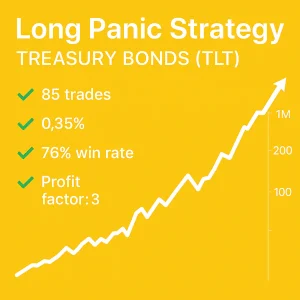
A short-term swing strategy designed to trade during market “panic” moments in the bond market – backtested on the TLT ETF with rare but high-probability entries. ✔️ 85 trades✔️ 0.35% average gain per trade✔️ 76% win rate✔️ Profit factor: 3✔️ 1.3% annual return (CAGR)✔️ 2.5% market exposure✔️ Risk-adjusted return: 52%✔️ Max drawdown: -2.7% You’ll get…
-
199,00 $
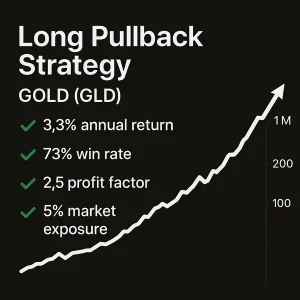
A swing trading strategy designed to capture short-term pullbacks in gold, with entries and exits at the close. Backtested on the GLD ETF and also effective on major stock indices like SPY and QQQ. This was our Monthly Trading Edge for February 2025. ✔️ 90 trades✔️ 0.75% average gain per trade✔️ 73% win rate✔️ Profit…
-
199,00 $
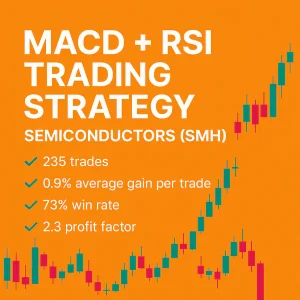
A short-term swing trading strategy combining MACD and RSI indicators – backtested on the SMH ETF. Built for multi-day trades, with strong performance and improved results when paired with a trend filter (not included). ✔️ 235 trades✔️ 0.9% average gain per trade✔️ 73% win rate✔️ Profit factor: 2.3✔️ 8% annual return (CAGR)✔️ 14% market exposure✔️…
-
199,00 $
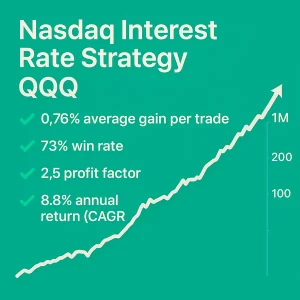
A swing trading strategy driven by interest rate levels – entering positions at the open following a signal. Backtested on the QQQ ETF tracking the Nasdaq 100. ✔️ 264 trades✔️ 0.76% average gain per trade✔️ 73% win rate✔️ Profit factor: 2.5✔️ 8.8% annual return (CAGR)✔️ 16% market exposure✔️ Risk-adjusted return: 55%✔️ Max drawdown: -19% You’ll…
-
199,00 $
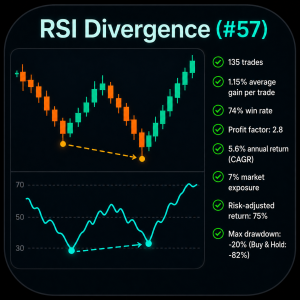
This RSI divergence strategy complements other mean-reversion RSI strategies (because its logic is slightly different). This strategy complements other mean reversion strategies because the logic is slightly different. Published early 2022, and again as the trading edge for June 2026. ✔️ 135 trades✔️ 1.15% average gain per trade✔️ 74% win rate✔️ Profit factor: 2.8✔️ 5.6%…
-
199,00 $
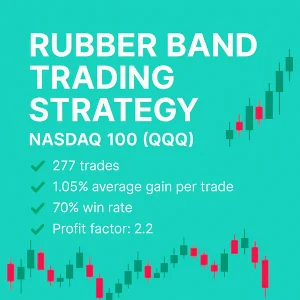
A mean reversion strategy built for fast and volatile markets – backtested on the QQQ ETF tracking the Nasdaq 100, ideal for snapping back after sharp moves. ✔️ 277 trades✔️ 1.05% average gain per trade✔️ 70% win rate✔️ Profit factor: 2.2✔️ 11.2% annual return (CAGR)✔️ 16% market exposure✔️ Risk-adjusted return: 68%✔️ Max drawdown: -23% You’ll…
-
199,00 $
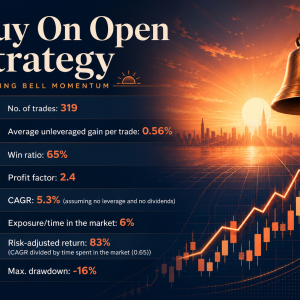
The strategy buys the open and holds for at least one day. Backtested on the ETF that tracks the S&P 500 (SPY). Work well for QQQ and XLK. This was our trading edge for April 2026. 319 trades 0.55% average gain per trade 65% win rate Profit factor: 2.4 5.3% annual return (CAGR) 6% market…
-
199,00 $
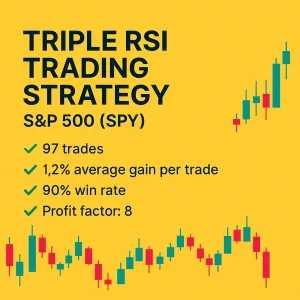
A short-term swing trading strategy that combines three RSI variations with a trend filter – backtested on the SPY ETF for high-accuracy entries during pullbacks. ✔️ 97 trades✔️ 1.2% average gain per trade✔️ 90% win rate✔️ Profit factor: 8✔️ 3.8% annual return (CAGR)✔️ 5% market exposure✔️ Risk-adjusted return: 69%✔️ Max drawdown: -13% You’ll get the…
