-
199,00 $
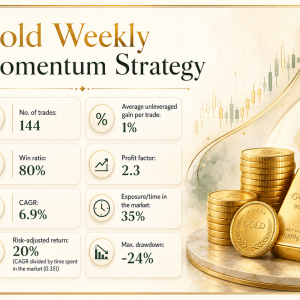
The strategy utilizes weekly bars and operates exclusively from the long side. The strategy was our monthly trading edge for October 2025. 144 trades 1% average gain per trade 80% win rate Profit factor: 2.3 6.9% annual return (CAGR) 35% market exposure Risk-adjusted return: 20% Max drawdown: -24% You’ll get the full trading rules –…
-
199,00 $
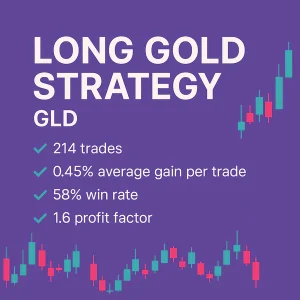
A long-only swing trading strategy for gold, entering and exiting at the close. Backtested on the GLD ETF for consistent performance. This was our Monthly Trading Edge for May 2025. ✔️ 214 trades✔️ 0.45% average gain per trade✔️ 58% win rate✔️ Profit factor: 1.6✔️ 4.5% annual return (CAGR)✔️ 21% market exposure✔️ Risk-adjusted return: 22%✔️ Max…
-
199,00 $
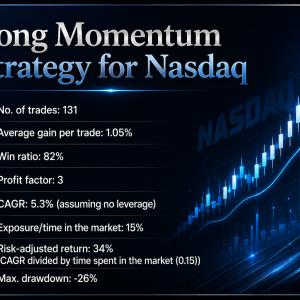
The strategy can be labeled a momentum strategy. It has two parameters to buy and one for when to sell. It’s based on daily bars. This strategy was our monthly Trading Edge for August 2025. 131 trades 1.05% average gain per trade 82% win rate Profit factor: 3 5.3% annual return (CAGR) 15% market exposure Risk-adjusted…
-
199,00 $
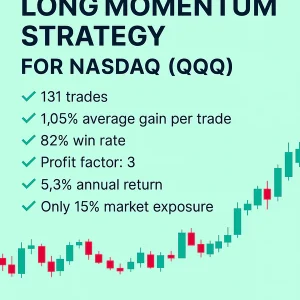
When the tech stocks start moving, they tend to gain momentum. This strategy is a momentum strategy – backtested on QQQ. ✅ 131 trades✅ 1.05% average gain per trade✅ 82% win rate✅ Profit factor: 3✅ 5.3% annual return (CAGR)✅ Only 15% market exposure✅ Risk-adjusted return: 34%✅ Max drawdown: -26% You’ll get the full trading rules…
-
199,00 $
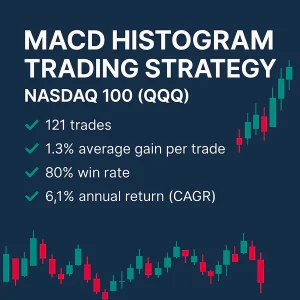
A backtested short-term trading strategy built on the MACD histogram – optimized for high precision and tested on the QQQ ETF tracking the Nasdaq 100. ✔️ 121 trades✔️ 1.3% average gain per trade✔️ 80% win rate✔️ Profit factor: 4.5✔️ 6.1% annual return (CAGR)✔️ 6% market exposure✔️ Risk-adjusted return: 103%✔️ Max drawdown: -20% You’ll get the…
-
199,00 $
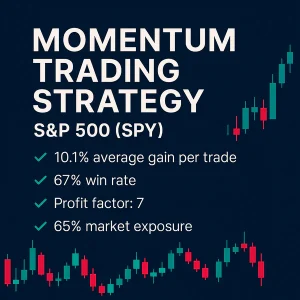
A flexible momentum-based strategy designed for both stocks and crypto – backtested here on the SPY ETF tracking the S&P 500 for long-term trend participation. ✔️ 43 trades✔️ 10.1% average gain per trade✔️ 67% win rate✔️ Profit factor: 7✔️ 5.9% annual return (CAGR)✔️ 65% market exposure✔️ Risk-adjusted return: 9%✔️ Max drawdown: -25% You’ll get the…
-
199,00 $
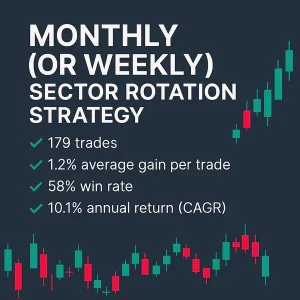
A rotation-based strategy that shifts between U.S. stocks (SPY), international stocks (EFA), gold (GLD), and bonds (TLT) – trading either weekly (Fridays) or monthly. Comes with rules in plain-English and Amibroker code. ✔️ 179 trades✔️ 1.2% average gain per trade✔️ 58% win rate✔️ Profit factor: 1.9✔️ 10.1% annual return (CAGR)✔️ 100% market exposure✔️ Risk-adjusted return:…
-
199,00 $
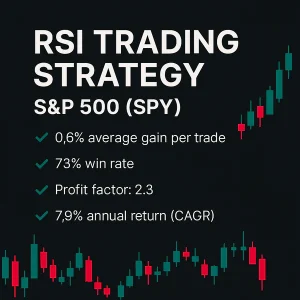
A backtested short-term swing trading strategy built on the classic RSI indicator – tested on the S&P 500 through the SPY ETF and designed for consistent, low-exposure performance. ✔️ 402 trades✔️ 0.6% average gain per trade✔️ 73% win rate✔️ Profit factor: 2.3✔️ 7.9% annual return (CAGR)✔️ 13% market exposure✔️ Risk-adjusted return: 57%✔️ Max drawdown: -16%…
-
199,00 $
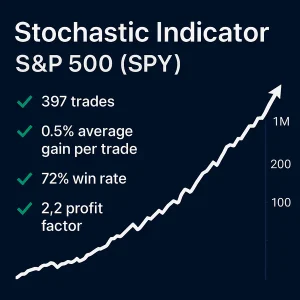
A backtested short-term trading strategy based on the Stochastic indicator – tested on the SPY ETF to identify high-probability setups with minimal market exposure. ✔️ 397 trades✔️ 0.5% average gain per trade✔️ 72% win rate✔️ Profit factor: 2.2✔️ 6.2% annual return (CAGR)✔️ 13% market exposure✔️ Risk-adjusted return: 47%✔️ Max drawdown: -20% You’ll get the full…
