-
490,00 $
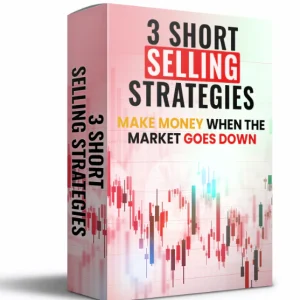
The short-selling strategies package consists of 4 (not 3 as indicated on the image) trading strategies that are backtested on three different ETFs. We have not backtested on @ES or any other contract, but it might work if trading same opening hours as SPY. All three short-selling strategies have not been published earlier on the…
-
199,00 $
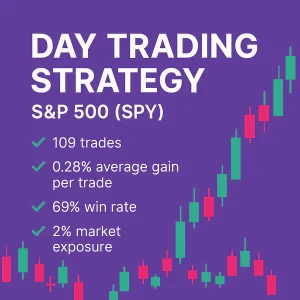
A short-only day trading strategy based on a seasonal pattern and one external indicator – backtested on the SPY ETF. It enters short at the open and covers at the close, with extremely low market exposure. ✔️ 109 trades✔️ 0.28% average gain per trade✔️ 69% win rate✔️ Profit factor: 2.5✔️ 1.3% annual return (CAGR)✔️ 2%…
-
199,00 $
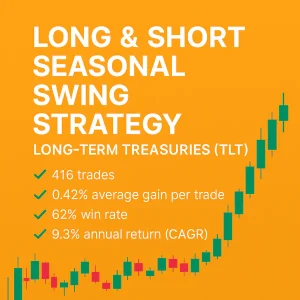
A backtested strategy combining both long and short seasonal setups. Entries occur at the close, with exits after a few days. Built for TLT – the ETF tracking long-term U.S. Treasury bonds. ✅ 416 trades✅ 0.42% average gain per trade✅ 62% win rate✅ Profit factor: 1.7✅ 9.3% annual return (CAGR)✅ 37% market exposure✅ Risk-adjusted return:…
-
199,00 $
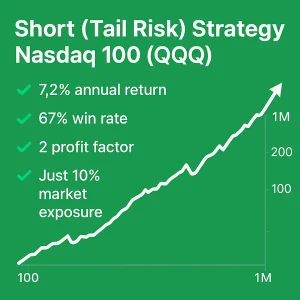
A tactical short strategy designed to perform during periods of high volatility in the Nasdaq 100. It trades infrequently and may bleed during bull markets, but has historically delivered strong tail-risk protection. This was our Monthly Trading Edge for July 2023 (Gold Members). ✔️ 156 trades✔️ 1.2% average gain per trade✔️ 67% win rate✔️ Profit…
-
199,00 $
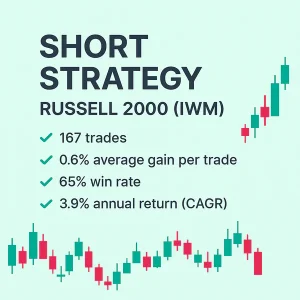
A short-only swing trading strategy backtested on the IWM ETF tracking the Russell 2000 index – designed to capitalize on market pullbacks with minimal exposure. This was our monthly trading edge for April 2024. ✔️ 167 trades✔️ 0.6% average gain per trade✔️ 65% win rate✔️ Profit factor: 2.3✔️ 3.9% annual return (CAGR)✔️ 4% market exposure✔️…
-
199,00 $
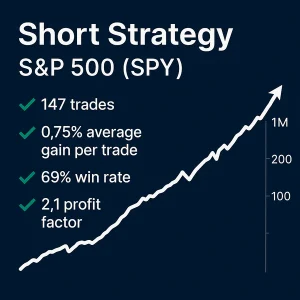
A short-only swing trading strategy that enters and exits at the close. Backtested primarily on the SPY ETF, where it has shown the most consistent results—but it has also performed well on QQQ and SMH. This was our Monthly Trading Edge for January 2025. ✔️ 147 trades✔️ 0.75% average gain per trade✔️ 69% win rate✔️…
-
199,00 $
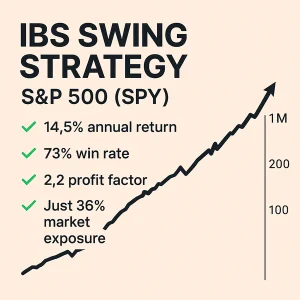
A backtested swing trading strategy using two simple variables for short entries, with fixed holding periods. Built and tested on TLT – the ETF tracking long-duration U.S. Treasury bonds. This is a SHORT strategy. ✅ 211 trades✅ 0.47% average gain per trade✅ 12% win rate✅ Profit factor: 1.8✅ 4.3% annual return (CAGR)✅ 26% market exposure✅…
-
199,00 $
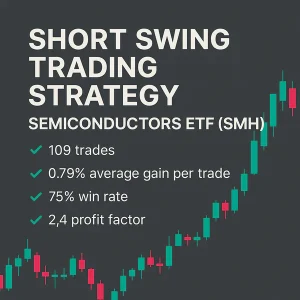
A backtested short swing trading strategy using two variables for both entry and short covering. Built for SMH – the ETF tracking the semiconductor sector. Also performs well on SPY and IWM. This is a SHORT strategy. ✅ 109 trades✅ 0.79% average gain per trade✅ 75% win rate✅ Profit factor: 2.4✅ 3.5% annual return (CAGR)✅…
-
199,00 $
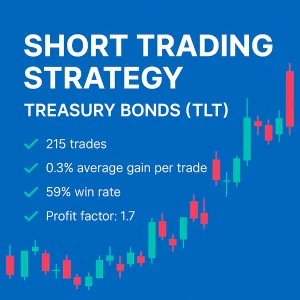
A short-only swing strategy for the bond market, built with three entry variables and one for exit. It enters at the open and exits at a future close. Backtested on the TLT ETF and optimized for tactical bond market pullbacks. This was our Monthly Trading Edge for August 2023 (Gold Members). ✔️ 215 trades✔️ 0.3%…
