-
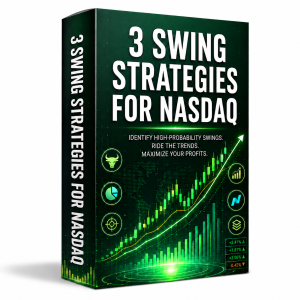
390,00 $
A trio of long-only swing trading strategies built for the Nasdaq 100 – thoroughly backtested on the QQQ ETF for consistent performance across market conditions. ✔️ 492 trades✔️ 0.75% average gain per trade✔️ 71% win rate✔️ Profit factor: 2.3✔️ 14.3% annual return (CAGR)✔️ 29% market exposure✔️ Risk-adjusted return: 49%✔️ Max drawdown: -31% For more info…
-
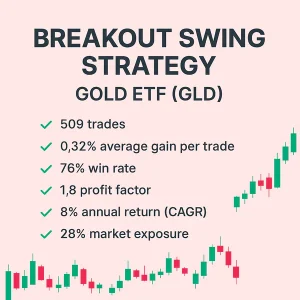
199,00 $
A backtested swing trading strategy built on breakout setups with three variables. Entries occur at the close, with exits a few days later. Tested on GLD – the ETF tracking the price of gold. ✅ 509 trades✅ 0.32% average gain per trade✅ 76% win rate✅ Profit factor: 1.8✅ 8% annual return (CAGR)✅ 28% market exposure✅…
-
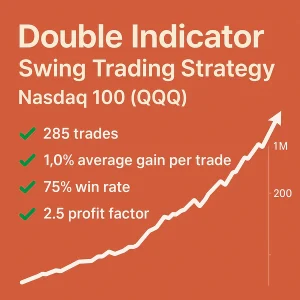
199,00 $
A backtested swing trading strategy using the often-overlooked ADX indicator, combined with a second signal filter. Tested on QQQ, the ETF tracking Nasdaq 100. ✅ 285 trades✅ 1.0% average gain per trade✅ 75% win rate✅ Profit factor: 2.5✅ 11% annual return (CAGR)✅ Only 17% market exposure✅ Risk-adjusted return: 66%✅ Max drawdown: -25% You’ll get the…
-

199,00 $
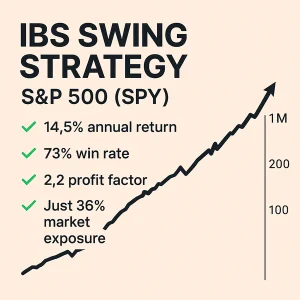
A backtested swing trading strategy built on the IBS indicator with a smart twist. ✔️ 596 trades✔️ 0.77% average gain per trade✔️ 73% win rate✔️ Profit factor: 2.2✔️ 14.5% annual return (CAGR)✔️ Only 36% market exposure✔️ Risk-adjusted return: 40%✔️ Max drawdown: -22% You’ll get the full trading rules – ready to test and validate. We offer…
-
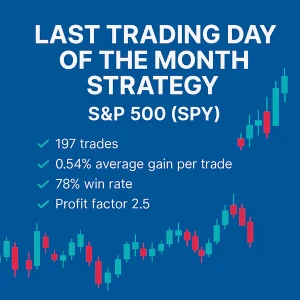
199,00 $
A seasonal swing trading strategy that enters on the last trading day of each month – backtested on the SPY ETF to capture a recurring end-of-month effect. ✔️ 197 trades✔️ 0.54% average gain per trade✔️ 78% win rate✔️ Profit factor: 2.5✔️ 3.4% annual return (CAGR)✔️ 6% market exposure✔️ Risk-adjusted return: 59%✔️ Max drawdown: -13% You’ll…
-
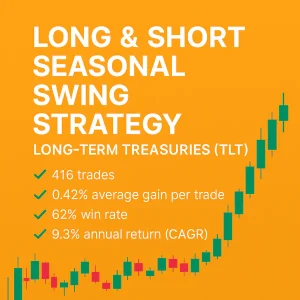
199,00 $
A backtested strategy combining both long and short seasonal setups. Entries occur at the close, with exits after a few days. Built for TLT – the ETF tracking long-term U.S. Treasury bonds. ✅ 416 trades✅ 0.42% average gain per trade✅ 62% win rate✅ Profit factor: 1.7✅ 9.3% annual return (CAGR)✅ 37% market exposure✅ Risk-adjusted return:…
-
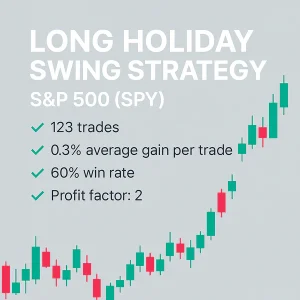
199,00 $
A backtested swing trading strategy that takes advantage of the market’s behavior around holidays – simple, effective, and built on historical S&P 500 (SPY) data. ✔️ 123 trades✔️ 0.3% average gain per trade✔️ 60% win rate✔️ Profit factor: 2✔️ 1.2% annual return (CAGR)✔️ Only 2% market exposure✔️ Risk-adjusted return: 60%✔️ Max drawdown: -7% You’ll get…
-
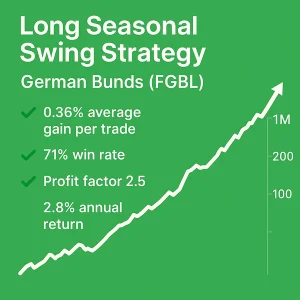
199,00 $
A backtested seasonal swing trading strategy built specifically for the German Bunds (FGBL) – designed to exploit recurring patterns in one of Europe’s most liquid bond markets. ✔️ 179 trades✔️ 0.36% average gain per trade✔️ 71% win rate✔️ Profit factor: 2.5✔️ 2.8% annual return (CAGR)✔️ 15% market exposure✔️ Max drawdown: -5% You’ll get the full…
-
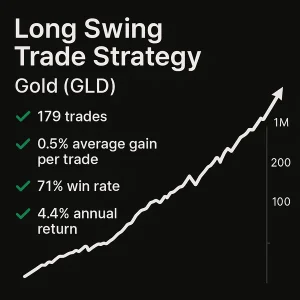
199,00 $
A backtested swing trading strategy built for gold – designed to capture short-term edges in a notoriously difficult market using the GLD ETF. ✔️ 179 trades✔️ 0.5% average gain per trade✔️ 71% win rate✔️ Profit factor: 2.1✔️ 4.4% annual return (CAGR)✔️ 10% market exposure✔️ Risk-adjusted return: 42%✔️ Max drawdown: -14% You’ll get the full trading…
-
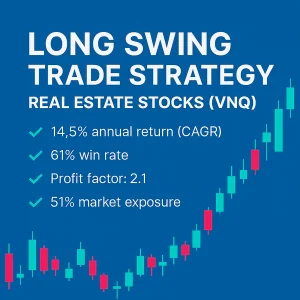
199,00 $
A backtested swing trading strategy designed for the real estate sector – built on the VNQ ETF and optimized for strong, risk-adjusted returns. ✔️ 375 trades✔️ 0.82% average gain per trade✔️ 61% win rate✔️ Profit factor: 2.1✔️ 14.5% annual return (CAGR)✔️ 51% market exposure✔️ Risk-adjusted return: 28%✔️ Max drawdown: -33% You’ll get the full trading…
-
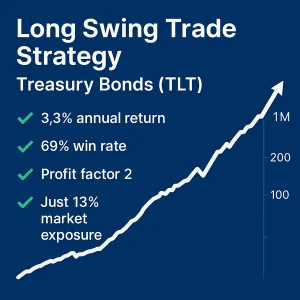
199,00 $
A backtested swing trading strategy tailored for the U.S. Treasury bond market – built on the TLT ETF to deliver solid performance with minimal market exposure. ✔️ 242 trades✔️ 0.31% average gain per trade✔️ 69% win rate✔️ Profit factor: 2✔️ 3.3% annual return (CAGR)✔️ 13% market exposure✔️ Risk-adjusted return: 24%✔️ Max drawdown: -9% You’ll get…
-
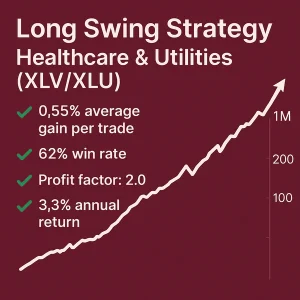
199,00 $
A seasonal swing trading strategy built for XLV and XLU ETFs. Uses three entry conditions and two for exit. Trades enter at the open and exit after 4–5 days on average. ✅ 160 trades✅ 0.55% average gain per trade✅ 62% win rate✅ Profit factor: 2.0✅ 3.3% annual return (CAGR)✅ 9% market exposure✅ Risk-adjusted return: 34%✅…
-
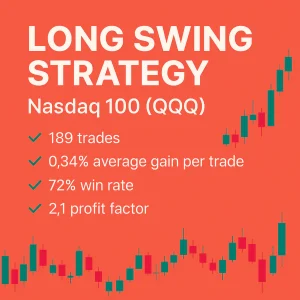
199,00 $
A backtested swing trading strategy using three entry variables and one for exit. Entry is at the close and exit takes place one or more trading days later. Built on QQQ – the ETF tracking the Nasdaq 100. ✅ 189 trades✅ 0.75% average gain per trade✅ 72% win rate✅ Profit factor: 2.1✅ 6.0% annual return…
-
199,00 $
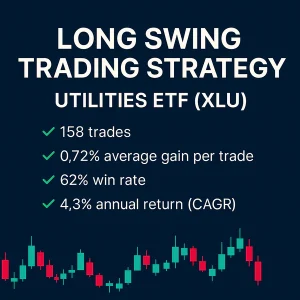
A backtested swing trading strategy with two entry/exit variables, designed for XLU – the ETF tracking U.S. utilities. Ideal for those looking to capture moves in a traditionally defensive sector. ✅ 158 trades✅ 0.72% average gain per trade✅ 62% win rate✅ Profit factor: 1.9✅ 4.3% annual return (CAGR)✅ 14% market exposure✅ Risk-adjusted return: 30%✅ Max…
-
199,00 $
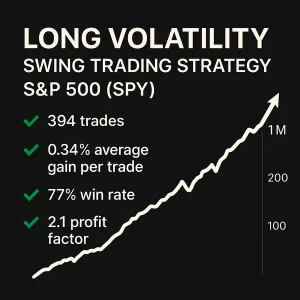
A backtested long-volatility strategy built for SPY – the ETF tracking the S&P 500. The strategy enters on strong close days (often with high RSI) and exits based on one defined variable. ✅ 394 trades✅ 0.34% average gain per trade✅ 77% win rate✅ Profit factor: 2.1✅ 4.1% annual return (CAGR)✅ 10% market exposure✅ Risk-adjusted return:…
-
199,00 $
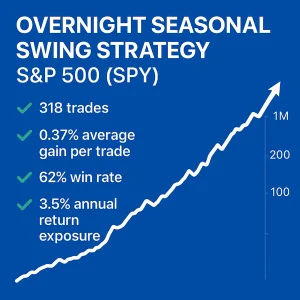
A backtested seasonal swing trading strategy with three entry variables and one exit rule. It enters at the open and exits at the close the following day. Tested on SPY – the ETF tracking the S&P 500. ✅ 318 trades✅ 0.37% average gain per trade✅ 62% win rate✅ Profit factor: 2.0✅ 3.5% annual return (CAGR)✅…
-
199,00 $
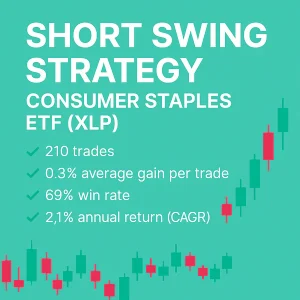
A backtested short swing trading strategy built for XLP – the ETF tracking consumer staples. Uses five entry variables and two for exit. The average holding time is 2.7 days. ✅ 210 trades✅ 0.3% average gain per trade✅ 69% win rate✅ Profit factor: 2.1✅ 2.1% annual return (CAGR)✅ Only 6% market exposure✅ Risk-adjusted return: 36%✅…
-
199,00 $
A backtested swing trading strategy using two simple variables for short entries, with fixed holding periods. Built and tested on TLT – the ETF tracking long-duration U.S. Treasury bonds. This is a SHORT strategy. ✅ 211 trades✅ 0.47% average gain per trade✅ 12% win rate✅ Profit factor: 1.8✅ 4.3% annual return (CAGR)✅ 26% market exposure✅…
-
199,00 $
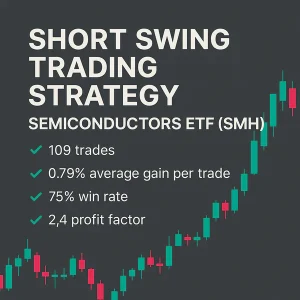
A backtested short swing trading strategy using two variables for both entry and short covering. Built for SMH – the ETF tracking the semiconductor sector. Also performs well on SPY and IWM. This is a SHORT strategy. ✅ 109 trades✅ 0.79% average gain per trade✅ 75% win rate✅ Profit factor: 2.4✅ 3.5% annual return (CAGR)✅…
-
199,00 $
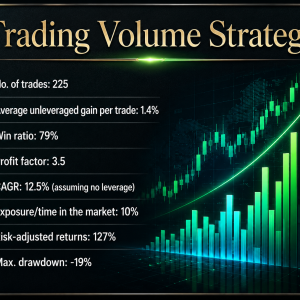
The strategy uses volume as one of the parameters. The strategy buys the next open after the signal. This strategy was our monthly Trading Edge for January 2026. 225 trades 1.4% average gain per trade 79% win rate Profit factor: 3.5 12.5% annual return (CAGR) 10% market exposure Risk-adjusted return: 127% Max drawdown: -19% You’ll…
-
199,00 $
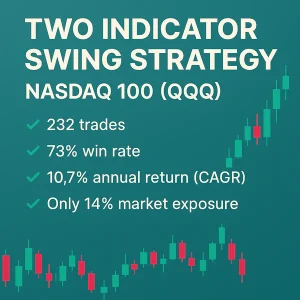
A backtested swing trading strategy using the popular IBS indicator combined with a second filter – built to enhance performance on the Nasdaq 100 ETF (QQQ). ✅ 232 trades✅ 1.2% average gain per trade✅ 73% win rate✅ Profit factor: 2.7✅ 10.7% annual return (CAGR)✅ Only 14% market exposure✅ Risk-adjusted return: 76%✅ Max drawdown: -19% You’ll…
-

199,00 $
A backtested swing trading strategy built on volatility bands. ✔️ 189 trades✔️ 1.6% average gain per trade✔️ 80% win rate✔️ Profit factor: 3.1✔️ 12.1% annual return (CAGR)✔️ Only 11% market exposure✔️ Risk-adjusted return: 110%✔️ Max drawdown: -19.5% You’ll get the full trading rules – ready to test and validate. We offer full trading code in TradingView/Python, Amibroker, Tradestation, and NinjaTrader. If your code…
-

199,00 $
A backtested swing trading strategy using the Williams %R indicator, enhanced with a second custom filter, applied on QQQ – the ETF tracking the Nasdaq 100. ✅ 255 trades✅ 1.13% average gain per trade✅ 75.7% win rate✅ Profit factor: 2.88✅ 11.4% annual return (CAGR)✅ Only 14.1% market exposure✅ Risk-adjusted return: 81.2%✅ Max drawdown: -20.8% You’ll get the full trading rules – ready to…
-
199,00 $
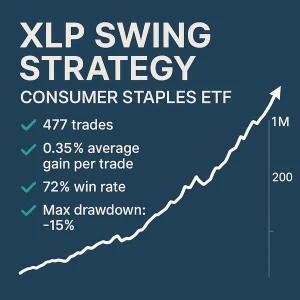
A backtested swing trading strategy developed for XLP – the ETF tracking consumer staples like Walmart, Procter & Gamble, and more. Its behavior differs from broad stock indices, offering diversification. ✅ 477 trades✅ 0.35% average gain per trade✅ 72% win rate✅ Profit factor: 1.8✅ 8.1% annual return (CAGR)✅ 32% market exposure✅ Risk-adjusted return: 20%✅ Max…
-
199,00 $
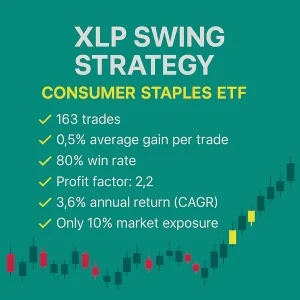
A backtested swing trading strategy designed for XLP – the ETF tracking consumer staples like Walmart and Procter & Gamble. Built on two variables, this strategy offers diversification compared to broader indices. ✅ 163 trades✅ 0.5% average gain per trade✅ 80% win rate✅ Profit factor: 2.2✅ 3.6% annual return (CAGR)✅ Only 10% market exposure✅ Risk-adjusted…
