-
199,00 $
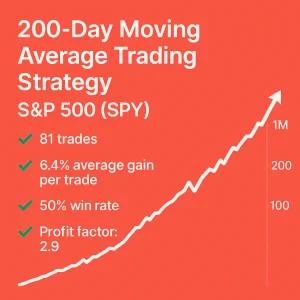
A classic long-term trend-following strategy using the 200-day moving average – with a small twist for improved performance. Backtested on the SPY ETF tracking the S&P 500. ✔️ 81 trades✔️ 6.4% average gain per trade✔️ 50% win rate✔️ Profit factor: 2.9✔️ 6.9% annual return (CAGR)✔️ 70% market exposure✔️ Risk-adjusted return: 9.9%✔️ Max drawdown: -22% (Buy…
-

199,00 $
A set of three complementary trend-following strategies with unique entry signals and a shared exit method – all backtested on the SPY ETF tracking the S&P 500. ✔️ 22 trades✔️ 31.9% average gain per trade✔️ 77% win rate✔️ Profit factor: 6✔️ 7.6% annual return (CAGR)✔️ 81% market exposure✔️ Risk-adjusted return: 9.4%✔️ Max drawdown: -35% For…
-
199,00 $
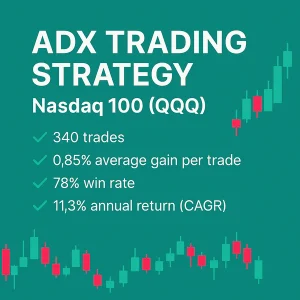
A trend-following strategy using the ADX indicator in combination with a secondary filter – backtested on the QQQ ETF for high-probability entries in trending environments. ✔️ 340 trades✔️ 0.85% average gain per trade✔️ 78% win rate✔️ Profit factor: 2.2✔️ 11.3% annual return (CAGR)✔️ 17% market exposure✔️ Risk-adjusted return: 65%✔️ Max drawdown: -21% You’ll get the…
-
199,00 $
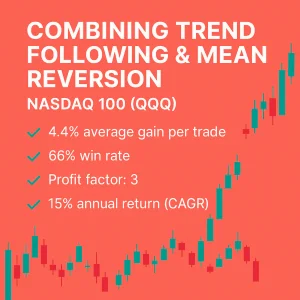
This strategy blends two complementary approaches—trend following and mean reversion—into one robust system. Backtested on the QQQ ETF, it demonstrates how combining different edges can enhance performance and reduce risk. ✔️ 99 trades✔️ 4.4% average gain per trade✔️ 66% win rate✔️ Profit factor: 3✔️ 15% annual return (CAGR)✔️ 72% market exposure✔️ Risk-adjusted return: 21%✔️ Max…
-
199,00 $
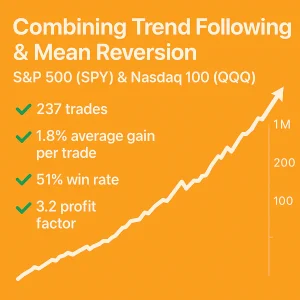
A hybrid strategy that combines a long-term trend-following approach with a short-term mean reversion component. Backtested on both SPY and QQQ ETFs, with a stronger equity curve for SPY. Trades are entered at the close (or optionally the next open for slightly better results). ✔️ 237 trades✔️ 1.8% average gain per trade✔️ 51% win rate✔️…
-
199,00 $
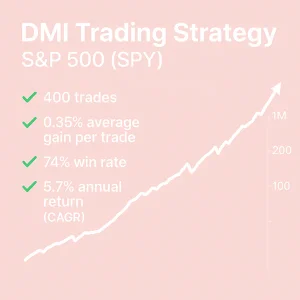
A swing trading strategy using the Directional Movement Index (DMI), combined with trend and mean reversion filters – backtested on the SPY ETF for high-accuracy trade setups. ✔️ 400 trades✔️ 0.35% average gain per trade✔️ 74% win rate✔️ Profit factor: 2✔️ 5.7% annual return (CAGR)✔️ 12% market exposure✔️ Risk-adjusted return: 34%✔️ Max drawdown: -17% You’ll…
-
199,00 $
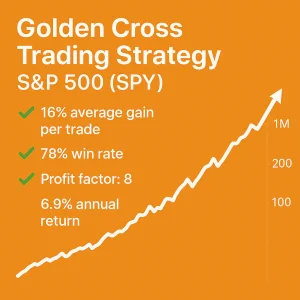
A classic trend-following strategy based on the Golden Cross indicator – historically effective across multiple markets and backtested here on the SPY ETF. ✔️ 33 trades✔️ 16% average gain per trade✔️ 78% win rate✔️ Profit factor: 8✔️ 6.9% annual return (CAGR)✔️ 70% market exposure✔️ Risk-adjusted return: 9.9%✔️ Max drawdown: -33% You’ll get the full trading…
-
199,00 $
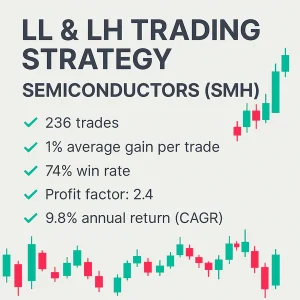
A mean reversion swing trading strategy built on the concept of lower lows and lower highs – backtested on the SMH ETF and also effective on QQQ and SPY. ✔️ 236 trades✔️ 1% average gain per trade✔️ 74% win rate✔️ Profit factor: 2.4✔️ 9.8% annual return (CAGR)✔️ 13% market exposure✔️ Risk-adjusted return: 73%✔️ Max drawdown:…
-
199,00 $
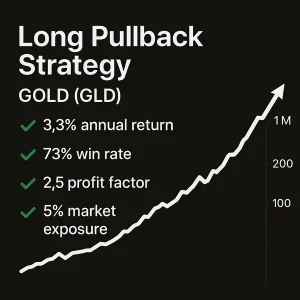
A swing trading strategy designed to capture short-term pullbacks in gold, with entries and exits at the close. Backtested on the GLD ETF and also effective on major stock indices like SPY and QQQ. This was our Monthly Trading Edge for February 2025. ✔️ 90 trades✔️ 0.75% average gain per trade✔️ 73% win rate✔️ Profit…
-
199,00 $
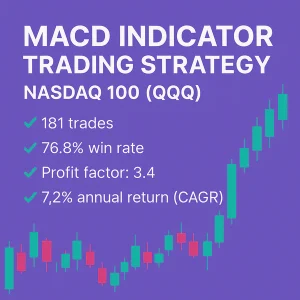
A refined swing trading strategy based on the MACD indicator – implemented with a creative twist and backtested on the QQQ ETF that tracks the Nasdaq 100. ✔️ 181 trades✔️ 1.01% average gain per trade✔️ 76.8% win rate✔️ Profit factor: 3.4✔️ 7.2% annual return (CAGR)✔️ 8.86% market exposure✔️ Risk-adjusted return: 81.31%✔️ Max drawdown: -11.15% You’ll…
-
199,00 $
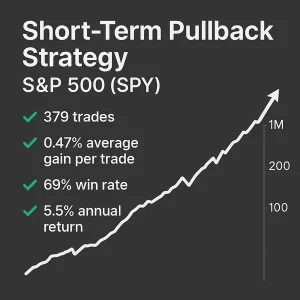
A swing trading strategy designed to exploit pullbacks from recent highs – backtested on the SPY ETF to capture short-term reversals in strong markets. ✔️ 379 trades✔️ 0.47% average gain per trade✔️ 69% win rate✔️ Profit factor: 2.52✔️ 5.5% annual return (CAGR)✔️ 14% market exposure✔️ Risk-adjusted return: 39%✔️ Max drawdown: -14% You’ll get the full…
-
199,00 $
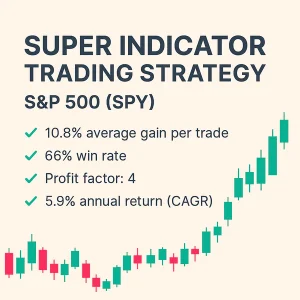
A weekly trend-following strategy built on the SuperTrend indicator – backtested on the SPY ETF to capture sustained momentum with clarity and simplicity. ✔️ 39 trades✔️ 10.8% average gain per trade✔️ 66% win rate✔️ Profit factor: 4✔️ 5.9% annual return (CAGR)✔️ 62% market exposure✔️ Risk-adjusted return: 9.5%✔️ Max drawdown: -24% You’ll get the full trading…
