Balance of Power (BOP) – Statistics, Facts And Historical Backtests
Sometimes, trading smart means using a tool that shows you where the power dynamics in the market lie so you can play along with the big boys, and that’s where the Balance of Power indicator comes in. What do you know about this indicator?
The Balance of Power (BOP) indicator is a momentum oscillator that evaluates the strength of buying and selling pressure in the market. It oscillates around the zero line, with positive values indicating buying pressure and negative values indicating selling pressure. The indicator compares a price bar’s body to its range and, thus, gauges the power of buyers to push prices higher and sellers to move prices lower.
In this post, we will take a look at most of the questions you may have about the Balance of Power indicator: what it is, how it works, and how you can use it to improve your trading strategies. Read on!
Key takeaways
- The Balance of Power (BOP) is a momentum oscillator that measures buying vs. selling pressure in the market.
- It oscillates around the zero line:
- Positive values indicate buying pressure (bullish).
- Negative values indicate selling pressure (bearish).
- The indicator assesses how strongly buyers push prices up and sellers push prices down.
- Introduced by Igor Levshin in the August 2001 issue of Technical Analysis of Stocks & Commodities magazine.
- BOP compares a price bar’s body to its range, then smooths the result using a simple moving average (SMA).BOP values range from +1 to -1:
- +1: All bars in the SMA period open at the low and close at the high (strong bullish).
- -1: All bars in the SMA period open at the high and close at the low (strong bearish).
- Positive readings = Bulls in control.
- Negative readings = Bears in control.
- Around zero = Power balance between bulls and bears.
Can be used to:
- Track price swings
- Generate zero-line crossover signals
- Spot divergences with price.
Related reading: – The best indicators for trading
What is the Balance of Power (BOP) indicator?
The Balance of Power (BOP) indicator is a momentum oscillator that evaluates the strength of buying and selling pressure in the market. It oscillates around the zero line, with positive values indicating buying pressure and negative values indicating selling pressure. The indicator gauges the power of buyers to push prices higher and sellers to move prices lower.
Introduced to the trading public by Igor Levshin in the August 2001 issue of Technical Analysis of Stocks & Commodities magazine, the indicator compares a price bar’s body to its range and then smooths the result with a simple moving average (SMA). The values range from +1 to -1, with +1 indicating that all the price bars for the entire period of the SMA opened at the low and closed at the high, and -1 suggesting that all the price bars for the entire period of the SMA opened at the high and closed at the low.
Generally, when the indicator is giving a positive reading, it means the bulls are dominating, and when the readings are negative, the bears are dominating. Values around the zero line suggest a balance of power between the bulls and the bears. The indicator can be used to track price swings. It gives zero-line crossover signals. as well as divergence signals.
How does the BOP indicator work in trading?
In trading, the BOP indicator works as a momentum indicator that can track price swings. It compares the difference between the close and open prices of each price bar to the entire range of the price bar. When the close price is higher than the open price, the indicator gives a positive reading, which suggests that the buyers are dominating during that trading session as the bar closed bullishly.
Conversely, when the close price is lower than the open price, the indicator gives a negative reading, which suggests that the sellers are dominating during that trading session as the bar closed bearishly.
The BOP indicator is plotted in the indicator window under the price chart. It consists of a single line that oscillates around the zero line, with values above zero indicating bullish momentum and values below zero indicating bearish momentum. When the indicator crosses above the zero line from below, it suggests that the market is becoming bullish, so traders can look for buying opportunities.
On the other hand, when the indicator crosses below the zero line from above, it suggests that the market is becoming bearish, allowing traders to look for selling opportunities.
The indicator can also give a divergence signal. A bullish divergence occurs when the price makes a lower low but the indicator makes a higher low, and this could be a buy signal if the market condition is right.
Conversely, a bearish divergence occurs when the price makes a higher high but the indicator makes a lower high, and this could be a sell signal if the market condition is right.
This is what the BOP might look like on a chart:

Balance of Power (BoP) trading strategy- rules, settings, returns, and performance
Let’s backtest a trading strategy that uses the Balance of Power – complete with trading rules and settings.
We make the following trading rules:
THIS SECTION IS FOR MEMBERS ONLY. _________________ BECOME A MEBER TO GET ACCESS TO TRADING RULES IN ALL ARTICLES CLICK HERE TO SEE ALL 400 ARTICLES WITH BACKTESTS & TRADING RULES
We backtested many assets, and it works best for gold (GLD). We buy and sell at the close.
Commissions and slippage of 0.03% per trade are included.
This is the equity curve for GLD from inception until today:
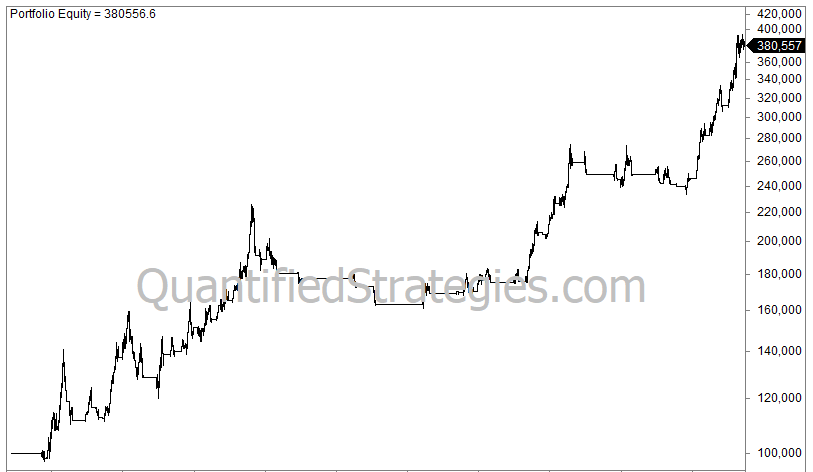
The strategy comprises 68 trades, with an average gain of 2.1% per trade. The win rate is 53%, and the max drawdown is 28%. The strategy is invested 41% of the time but still manages an annual return of 6.7%.
Balance of Power trading strategy – complete code
The Amibroker code for the backtest looks like this:
THIS SECTION IS FOR MEMBERS ONLY. _________________ BECOME A MEBER TO GET ACCESS TO TRADING RULES IN ALL ARTICLES
CLICK HERE TO SEE ALL 400 ARTICLES WITH BACKTESTS & TRADING RULES
Why use the Balance of Power indicator?
You use the Balance of Power indicator because it helps you gauge the strength of buyers and sellers in the market. It uses the difference between the close and open prices of each price bar to ascertain where the price momentum lies and standardizes it by dividing it by the entire range of the price bar. The price bars closing bullishly suggest buying momentum, while closing bearishly suggests selling momentum.
With the indicator, you can identify when the market momentum is to the upside so you look for buy setups, and when it is to the downside, you look for sell setups. You can easily combine it with trend indicators to create robust trading strategies.
What are the key components of BOP?
The key components of BOP are as follows:
- The difference between the close price and the open price: This forms the numerator in calculating the indicator. It is what determines where the balance of power lies. If the close is higher than the open, bulls are in control, and if the close is lower than the open, bears are in control.
- The range of the price bar: This is the difference between the high and low of the price bar. It forms the denominator in the BOP’s calculation.
- The smoothening: This refers to using a simple moving average of the BOP to smooth the data. The author recommended a 14-period moving average.
How to calculate the Balance of Power indicator?
To calculate the Balance of Power indicator, use this formula:
BOP = (Close — Open) / (High — Low)
Smoothed BOP = n-period SMA (BOP)
Where:
Close = the close of each price bar
Open = the open of each price bar
High — Low = the range of each price bar
n = the number of periods for the SMA
Here’s how to calculate the BOP:
- Determine the number of periods (n) to use for smoothing.
- For each price bar within that period, subtract the open price from the close price and divide the difference by the entire range of the price bar (High – Low).
- Calculate the average of the result in step 2 over the n periods.
- Repeat steps 2 and 3 for every new price bar that closes.
What does a positive BOP value indicate?
A positive BOP value indicates that the price has been closing bullishly for the most part of the period under consideration. In other words, the close prices were usually higher than the open prices over the periods of smoothing. This suggests that buyers are in control of the market.
At the indicator level, it means that the indicator line is above the zero line, which implies that the market momentum is bullish. In this case, traders are better off looking for buying opportunities.
What does a negative BOP value signify?
A negative BOP value indicates that the price has been closing bearishly for the most part of the periods under consideration. In other words, the close prices were usually lower than the open prices over the periods of smoothing. This suggests that sellers are in control of the market.
At the indicator level, it means that the indicator line is below the zero line, which implies that the market momentum is bearish. In this case, traders are better off looking for selling opportunities.
How to interpret BOP signals in trading?
To interpret BOP signals in trading, you have to consider the direction of the main trend. Generally, a BOP crossover above the zero line suggests a rising bullish momentum and a cross below suggests increasing bearish momentum. However, you only consider bullish momentum for buying opportunities if the overall market trend is up.
In other words, in an uptrend, a bullish crossover can be a buy signal while a bearish crossover may not signal anything. Conversely, in a downtrend, a bearish crossover can be a sell signal while a bullish crossover is not a signal.
The same is true for the divergence signals — use the bullish divergence as a buy signal only in an uptrend and the bearish divergence as a sell signal only in a downtrend.
What are the advantages of using BOP?
The advantages of using BOP include:
- The indicator can show where the market momentum lies
- It can help in making trading decisions
- It can be used to determine when to enter the market
- It can be combined with other indicators, especially trend indicators, to create robust trading strategies
- It provides a way to assess the market for potential reversals
What are the limitations of the Balance of Power indicator?
The limitations of the Balance of Power indicator include:
- It cannot show the direction of the main trend unless you use a multi-timeframe analysis where the swing in a much higher timeframe can be a trend in a lower timeframe
- Even with an SMA smoothing, the indicator can still be quite choppy, leading to false crossover signals
- The divergence signal can persist while the price continues to move without a reversal
How to incorporate BOP into a trading strategy?
To incorporate BOP into a trading strategy, you have to understand how the indicator works so you know how best it can fit into your existing strategy. If your strategy is trend-following, the BOP may not be very useful, as it tracks individual price swings and not the main trend.
For a breakout strategy, you can use the BOP to confirm that the market momentum is in the direction of the breakout. You can also use the indicator for swing trading where it can help you identify the emergence of new price swings in the trend direction.
Can BOP be used for all financial markets?
Yes, the BOP can be used for all financial markets since it is based on the price data alone and all financial markets display their price data. This is unlike volume-based indicators, which cannot be used in certain financial markets, such as the spot forex market where there is no central exchange to document the volume data.
However, while the BOP can be used for all financial markets, it works better in markets that are trending in one direction with clear impulse swings and pullback swings.
What timeframes work best with the BOP indicator?
The timeframes that work best with the BOP indicator will depend on your trading style and backtesting results. If you are a day trader, you will have to trade on intraday timeframes, such as the hourly, 30-minute, 15-minute, and even 5-minute timeframes. But it is your backtesting results that will tell you the particular timeframes that offer the best day trading performance. Similarly, if you are a swing trader, you will focus on the daily, 8-hourly, and 4-hourly timeframes. Your backtesting results will show you the best timeframe for swing trading.
How does BOP compare to other momentum indicators?
Compared to other momentum indicators, the BOP is very choppy on its own, which is why you have to smooth it with a long-period SMA. In terms of performance, the BOP is comparable to other momentum indicators, but what ultimately determines how an indicator performs is the strategy and how much edge the strategy has on the market being traded.
With a good strategy that has a reliable edge in the market, any indicator can perform well.
What are common BOP trading setups?
The common BOP trading setups are as follows:
- The zero-line crossover setup: This forms when the BOP line crosses the zero line. A cross above the zero line is a bullish signal, while a cross below the zero line is a bearish signal. The signal is valid only if it occurs in the direction of the trend. Thus, a buy signal is when the BOP line crosses above the zero line in an uptrend. A sell signal is when the BOP line crosses below the zero line in a downtrend.
- The divergence setup: This occurs when the price swings and the indicator swings are out of sync, suggesting a potential price reversal. The signal is valid only if it occurs in the direction of the trend. In an uptrend, a bullish divergence signal suggests that the downward pullback may be about to reverse for the uptrend to continue. In a downtrend, a bearish divergence signal indicates that the pullback is over, and the downtrend is set to continue.
How to combine BOP with other indicators?
To combine BOP with other indicators, look for indicators that can complement it. Being a momentum oscillator that tracks individual price swings, the BOP is best combined with trend indicators, such as the moving average. You use the moving average to identify the direction of the trend and also show dynamic support and resistance levels, and then, use the BOP to find entry signals to trade the impulse price swings in the trend direction.
What are the best practices for using BOP?
The best practices for using BOP are as follows:
- Combining the indicator with trend indicators to trade individual price swings in the trend direction
- Not using the indicator as a standalone trading strategy
- Using the indicator to confirm the momentum of a price breakout
- Trading only in the direction of the trend
How to customize the BOP indicator settings?
To customize the BOP indicator settings, do these:
- Create a trading strategy based on the indicator and backtest it.
- Experiment with different settings while backtesting the strategy to find the ones that work best for the market you are trading and the timeframe you trade on.
- Set up the indicator with the best-performing settings from your backtesting.
- Periodically evaluate the performance of the strategy to know when you need to tweak the settings
What are the common mistakes when using BOP?
The common mistakes when using BOP include:
- Not having a trading strategy with clear entry and exit criteria
- Not combining the indicator with other indicators or analysis tools to improve its performance
- Using the indicator as a standalone trading strategy
- Not backtesting your strategy before using it in the live market
- Not having a risk management plan
How to backtest a BOP-based strategy?
To backtest a BOP-based strategy, here are what to do:
- Identify and study the markets you want to backest your BOP-based strategy.
- State the parameters or settings to backtest for the strategy.
- Gather the historical data you need for the backtesting and divide the data into in-sample and out-of-sample data.
- Code the strategy into a trading algorithm.
- Run your backtesting on the in-sample data and optimize with the out-of-sample data, adjusting your parameters as needed.
- Evaluate the results of your backtesting
What tools support the Balance of Power indicator?
Tools you can use to support the Balance of Power indicator are the trendline, Fibonacci retracement tool, and support/resistance levels. You can use the trendline to delineate the direction of the trend and the Fibonacci tool and support/resistance level to mark key levels where a pullback is likely to reverse.
A BOP signal in the trend direction that forms when the price is at a key level has a higher odds of success.
How reliable is the BOP indicator in trending markets?
The BOP indicator is more reliable in trending markets than in non-trending markets. In trending markets, there are bigger impulse waves, which you can identify and trade with the BOP.
This is why you want to use the indicator when the market is trending and trade only in the direction of the trend.
How does BOP help in identifying reversals?
The BOP helps in identifying reversals by generating divergence signals. However, the signals are only effective for identifying the reversals of pullbacks, which mark the beginning of the next impulse waves in the trend direction.
Thus, a bullish divergence is only useful in an uptrend, and a bearish divergence is only useful in a downtrend.
What are expert tips for trading with BOP?
Here are some expert tips for trading with the BOP:
- Trade only in the direction of the trend.
- Combine the indicator with trend indicators so you can trade individual price swings in the trend direction.
- Do not use the indicator as a standalone trading strategy so you don’t trade against the trend.
Where to learn more about the Balance of Power indicator?
To learn more about the Balance of Power indicator, study this material again and again.
You can also check the August 2001 issue of Technical Analysis of Stocks & Commodities magazine where Igor Levshin described the indicator for the first time.