Laguerre RSI (Strategy, Rules, Code)
What Is the Laguerre RSI? This article is a practical short guide for traders.
The Laguerre RSI is a lesser-known but highly effective momentum indicator developed by John Ehlers. It aims to improve on the traditional Relative Strength Index (RSI) by applying a Laguerre filter, which smooths price data while maintaining responsiveness to recent price changes. Many traders prefer Laguerre RSI because it reacts faster than standard RSI and reduces noise during volatile markets.
In this article, we explore what the Laguerre RSI is, how it works, and how you can use it in systematic or discretionary trading strategies.
Related reading: –Complete list of trading indicators
How the Laguerre Filter Works
The core idea behind the Laguerre RSI is the Laguerre filter, a type of low-pass filter that smooths data with minimal lag. Instead of relying on a fixed-length moving average, the filter uses a gamma parameter (usually between 0.2 and 0.8) to adjust smoothing intensity.
A lower gamma makes the indicator more sensitive and faster to react; a higher gamma creates a smoother, slower curve.
The Laguerre filter produces four intermediate values (L0, L1, L2, L3), each one being a filtered version of the last. These layers help the indicator separate short-term moves from longer swings.
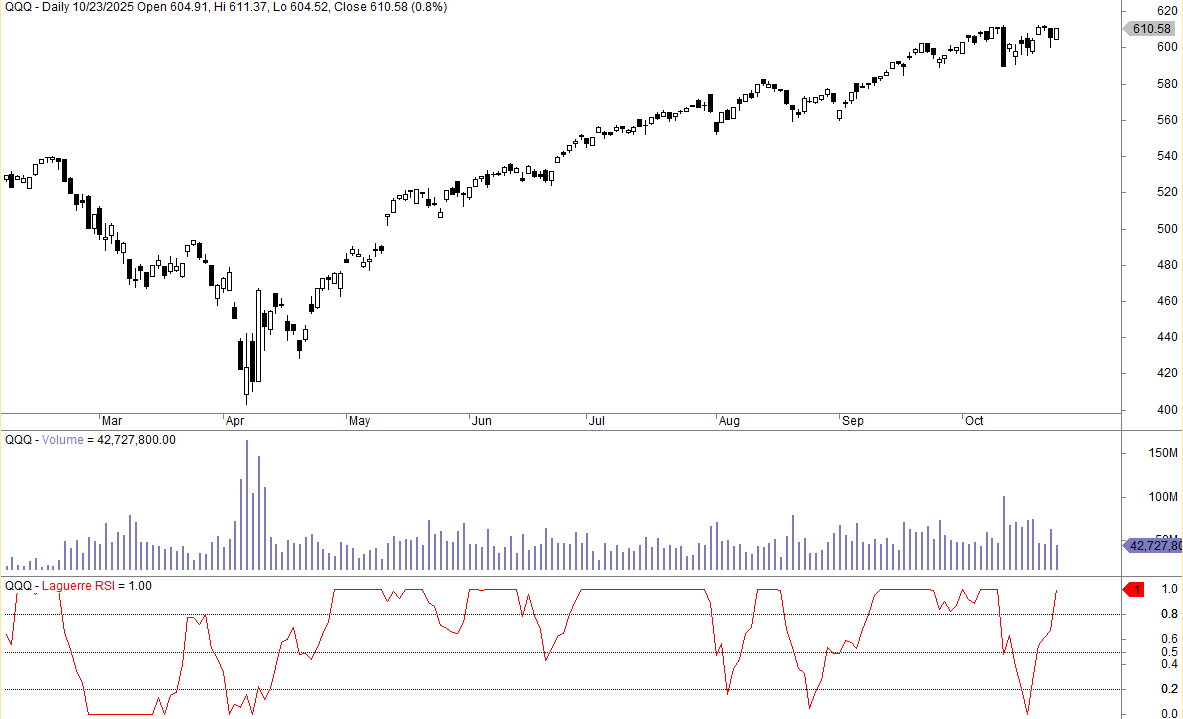
Laguerre RSI example
Here’s an example of the less fluctuations of the Laguerre RSI (please see the lower pane):
Calculating the Laguerre RSI
The Laguerre RSI applies RSI logic to the four filtered levels. It measures how much of the filtered price movement is up versus down.
The general steps:
- Apply the Laguerre filter to the price series to compute L0 through L3.
- Compare each Laguerre level with the one before it to classify up or down movement.
- Accumulate gains and losses.
- Compute RSI normally: RS / (1 + RS).
Despite its sophisticated math, the result is intuitive: a smooth oscillator ranging from 0 to 1 (or 0 to 100 depending on the platform), with less whipsaw than traditional RSI.
Why Traders Use the Laguerre RSI
The Laguerre RSI is popular among short-term and swing traders for several reasons:
• It smooths noise without lagging too far behind price
• It responds quickly to momentum shifts
• It reduces false signals common in classic RSI
• It performs well in both mean-reversion and trend-following systems
• It adapts naturally to volatile markets
Because of its flexibility, the Laguerre RSI is used in many trading strategies, including trend confirmation, pullback entries, and counter-trend reversals.
Parameters: How to Choose the Right Gamma
Gamma is the key parameter of the Laguerre RSI. Common values:
• 0.2: Very fast, best for short-term trading
• 0.5: Balanced, widely used default
• 0.7–0.8: Smooth and slow, suitable for higher timeframes
Most traders start with gamma = 0.5 and adjust based on the asset’s volatility or personal preference.
How to Use the Laguerre RSI in Trading
There are several common ways to use the Laguerre RSI.
Mean-Reversion Signals
A popular approach is to look for oversold and overbought zones:
• Buy when Laguerre RSI drops below 0.2 and then crosses back above
• Sell when Laguerre RSI rises above 0.8 and then crosses back below
Because the indicator is smooth, these levels often provide clean signals.
Trend-Following Entries
In strong trends, the Laguerre RSI tends to hover near extremes:
• In uptrends, look for dips toward 0.2 that quickly bounce
• In downtrends, look for rallies toward 0.8 that fade
Trend traders use these pullbacks as low-risk entry points.
Using Zero Line (0.5) as Momentum Bias
When the Laguerre RSI stays above 0.5, momentum is bullish. Below 0.5 indicates bearish momentum.
This simple rule can be used as a filter for systematic strategies.
Example Laguerre RSI Strategy
Below is a simple, research-friendly strategy used for mean-reversion:
Entry:
• Go long when Laguerre RSI crosses above 0.2
• Go short when Laguerre RSI crosses below 0.8
Exit:
• Close long when Laguerre RSI crosses below 0.8
• Close short when Laguerre RSI crosses above 0.2
You can also pair the indicator with moving averages, volatility filters, or volume-based rules to make it more robust.
Laguerre RSI Trading Strategy
We make the following trading rules:
- Go long when the Laguerre RSI is 0; and
- Sell after two trading days.
We buy and sell at the close.
This is the equity curve for SPY, the ETF that tracks the S&P 500, from inception in 1993 until today:
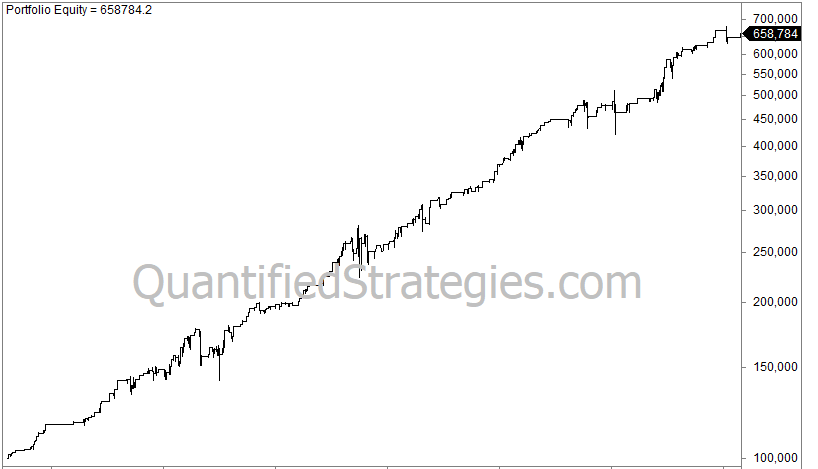
There are 519 trades, and the average gain per trade is 0.4%. The win rate is 61%, and the most significant drawdown is moderate at 21%. The strategy is invested only 12% of the time.
Pros and Cons of Laguerre RSI
Advantages
• Smoother and more responsive than classic RSI
• Easy to understand and implement
• Works well in both trending and mean-reverting conditions
• Excellent for short-term traders
Limitations
• Gamma parameter can be subjective
• Still prone to false signals in highly choppy markets
• Best used as part of a broader system, not standalone
Final Thoughts
The Laguerre RSI is a powerful and flexible oscillator that offers smoothness and responsiveness. For traders who find the classic RSI too noisy or slow, the Laguerre version can be a valuable upgrade. As always, backtest any strategy that uses this indicator and tailor it to your market and timeframe.
Laguerre RSI code
Below is the Amibroker code for Laguerre RSI:
THIS SECTION IS FOR MEMBERS ONLY. _________________ BECOME A MEBER TO GET ACCESS TO TRADING RULES IN ALL ARTICLES CLICK HERE TO SEE ALL 400 ARTICLES WITH BACKTESTS & TRADING RULES