Daily Patterns Trading Strategy (1.57% Per Month)
Recently, we came across an interesting research paper called A Unified Framework for Anomalies Based on Daily Returns by Nusret Cakici et al. The authors examined the price performance of stocks over the past 21 trading days and rebalanced the portfolio monthly.
The researchers used a flexible machine learning tool called an elastic net. The computer analyzed decades of U.S. equity data from 1937 to 2024 to learn exactly how these 21 days map to future performance.
Below, we summarize the article. Unfortunately, the authors did not explicitly describe how they evaluated performance, but we believe the paper offers valuable insights for potential trading strategies.
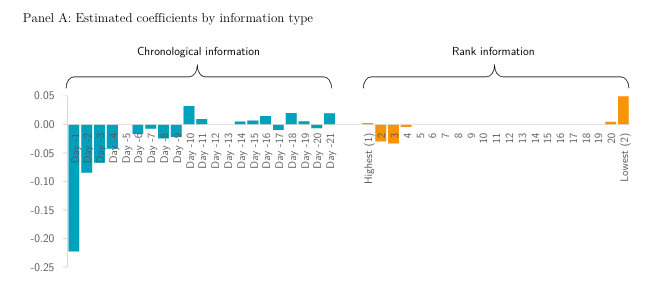
The authors found out that the sequence of daily moves is important. By examining the “raw material” of the last 21 trading days, they identified patterns that most traders miss. They introduced the Daily Return Information Factor (DRIF), a signal that extracts predictive power from the full distribution of a stock’s returns over the previous month (21 days).
The Two Dimensions of Stock Behavior
This is what the DRIF looked at:
- Chronological Information (Timing): This tracks when a return happened. It captures “price pressure” and “liquidity shocks”. Basically, how the market reacts to recent news versus older news. This preserves the order of returns to see if a stock crashed yesterday or three weeks ago. This helps identify “reversals,” where stocks that were unfairly beaten down recently are likely to bounce back.
- Rank Information (Magnitude): This ignores the calendar and looks at how extreme the jumps and drops were. This captures “lottery-style” behavior where investors get over-excited or overly scared by big moves.
This ignores the dates and looks only at the size of the gains and losses. It identifies “lottery-like” jumps that often cause human investors to overreact. - Key Insight: The research found that timing is the dominant factor. Investors react much more strongly to the order of events than to how extreme the price changes were.
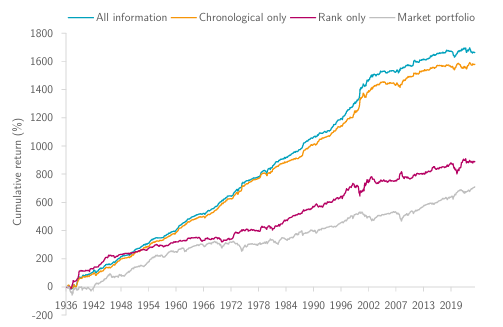
The Performance: 1.57% Monthly Returns
This is how their strategy performed:
- In tests spanning from 1937 to 2024, a strategy buying high-DRI stocks and selling low-DRI stocks earned an average of 1.57% per month.
- It has an impressive Sharpe ratio of 1.23, meaning the returns are very high relative to the risk involved.
- Even in the modern era (2000–2024), the strategy still performs well, earning roughly 1% per month.
This is how the factors contributed:
The financial world is currently crowded with a “factor zoo”, over 150 different trading tricks and anomalies that claim to beat the market. The researchers found that the DRI strategy is so powerful that it actually subsumes many of these other strategies.
Is it Practical? Can You Trade It?
You might wonder if these returns disappear once you account for the costs of frequent trading. The study found that although the strategy exhibits high turnover, its returns are sufficient to offset the typical trading costs faced by institutional investors.
Furthermore, while the strategy is strongest among smaller, less liquid companies, it remains statistically significant even for the largest “big-cap” stocks in the market. Interestingly, the strategy tends to perform even better during periods of high market volatility and higher interest rates.
This is what the authors wrote:
- Trading Costs: While this strategy entails substantial buying and selling (high turnover), its returns are sufficient to offset typical institutional trading costs.
- Small vs. Large Caps: It performs best on smaller, less liquid stocks, but it remains statistically significant for large-cap companies.
- Market Volatility: The strategy is more effective during periods of high market volatility and higher interest rates.