Rotation Strategy for SPY, EEM, EFA, TLT, and GLD

Today, we look at a rotation strategy for SPY, EEM, EFA, TLT, and GLD.
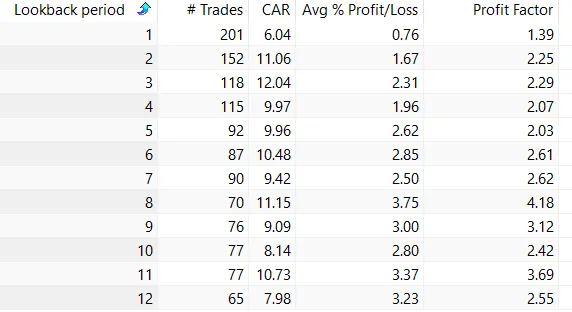
The basic idea is that assets showing positive relative momentum have a tendency to continue outperforming over intermediate time horizons, while assets with poor momentum may continue to lag. This has been the case for periods of 1 to 12 months. Long and shorter periods are not working.
In this strategy, we focus on five widely traded exchange-traded funds: SPY, representing U.S. equities; EFA, representing developed international equities; EEM, representing emerging market equities; GLD, representing gold; and TLT, representing long-term U.S. Treasury bonds.
Together, these ETFs provide exposure to several major asset classes and regions, allowing the strategy to rotate between growth-oriented, defensive, and diversifying assets depending on market conditions.
The goal of the strategy is to build a rules-based framework that periodically ranks these ETFs by momentum and invests in the strongest candidates. By doing so, the strategy attempts to participate in sustained market trends while reducing exposure to assets that are losing strength. This makes momentum rotation a simple but powerful tool for tactical asset allocation, risk management, and diversification.
Rotation Strategy for SPY, EEM, EFA, TLT, and GLD
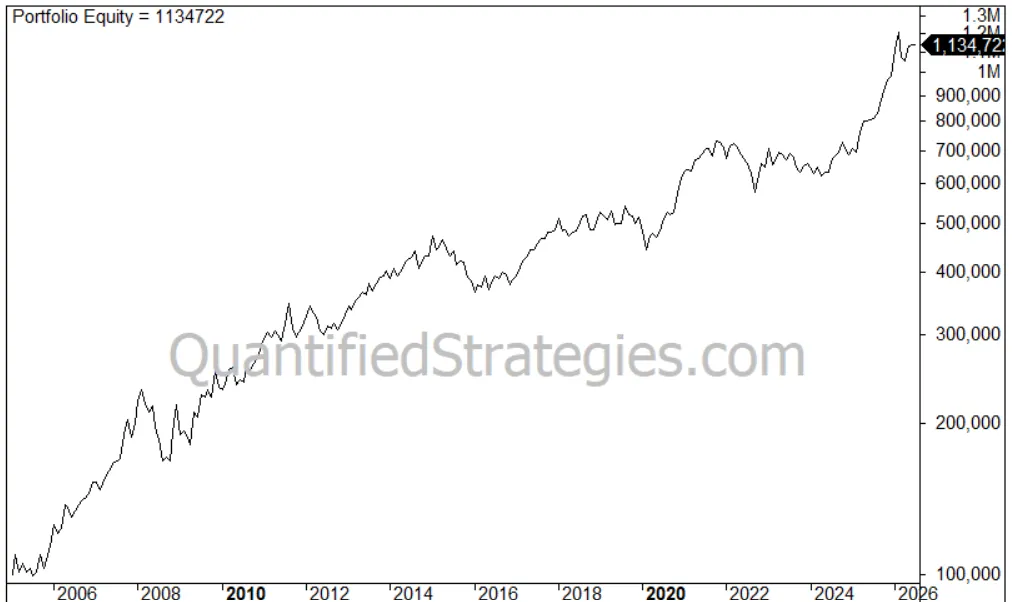
We backtest, of course, and we got the following results:
Strategy type: Rotation strategy.
Market: SPY, EEM, EFA, TLT, and GLD.
Performance
- No. of trades: 118
- Average gain per trade: 2.3%
- Win ratio: 62%
- Profit factor: 2.3
- Annual returns (CAGR): 12%
- Exposure/time in the market: 100%
- Risk-adjusted return: 12% (CAGR divided by time spent in the market (1))
- Max drawdown: 28%
Trading Rules
You find the trading rules at the bottom of the article
The strategy uses monthly bars.
Below are the results for lookback periods of 1 to 12 months: