

XLP Trading Strategies: Backtest and Trading Rules of the Consumer Staples Sector

XLP Trading Strategies focus on mean-reverting assets, such as the XLP ETF, using the Internal Bar Strength (IBS) indicator. The strategy involves entering trades based on specific criteria, including low IBS values from yesterday and today, as well as RSI(5) levels below 50, with exits triggered when today’s close exceeds yesterday’s high.
Key Takeaways
- Strategy targets mean-reverting XLP ETF behavior
- Uses Internal Bar Strength for entry signals
- Low IBS values indicate oversold conditions
- RSI(5) below 50 confirms weak momentum
- Enter trades at market close
- Exit when price breaks previous high
- Strategy trades infrequently with low exposure
- Mean reversion captures short-term price rebounds
The internal bar strength is defined as follows: (close-low)/(high-low). This indicator is very useful on mean revertive trading instruments, like for example XLP.

This article contains a simple but quite effective trading strategy using the internal bar strength indicator:
XLP Trading Strategies
(This article was first published in January 2018. Thus, 5 years out of sample, and the strategy has performed worse than in-sample.)
(The trading rules are at the end/bottom of the article.)
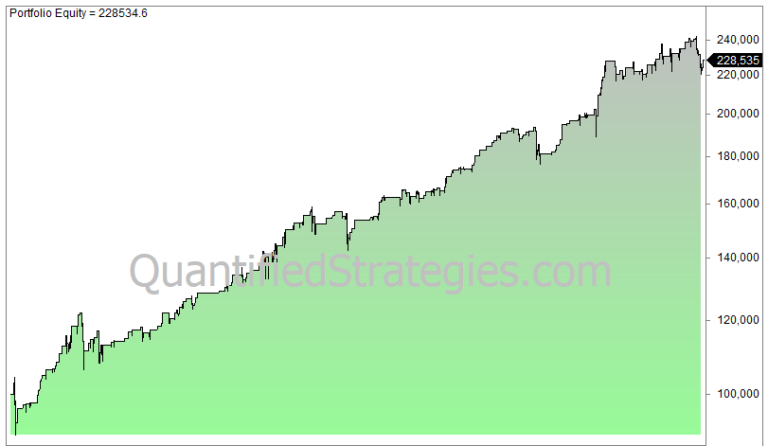
Here is the equity curve:
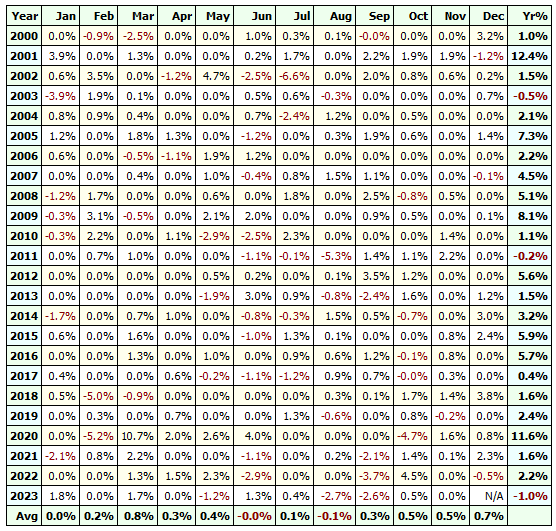
Annual returns:
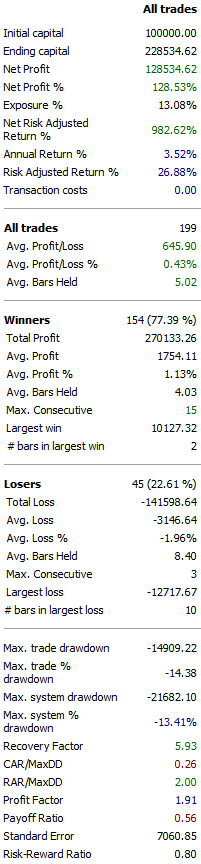
Here are all the trade details:
When testing for optimization there is a clear pattern that it’s best with a low IBS yesterday and a bit higher today.
Of course, the annual return is pretty low, but that is because the strategy spends most of the time on the sidelines. The strategy is invested around 13% of the time (see “exposure” in the image above.
———————
If you would like to have the Amibroker and Tradestation code for this strategy plus 70+ other free trading strategies published on this website, please click on this link:
Why is the IBS indicator useful for trading mean-reverting instruments?
The Internal Bar Strength (IBS) indicator is highly effective for mean-reversion because it measures where a security closes relative to its daily range. Unlike momentum indicators that look at price changes over many days, IBS is a “snapshot” of immediate sentiment. In mean-reverting assets like XLP (Consumer Staples), a close near the absolute bottom of the daily range often signals an “oversold” state that is likely to correct itself. By quantifying this daily exhaustion, traders can identify high-probability turning points where the selling pressure has likely peaked for the short term.
Which ETF does this trading strategy focus on?
This strategy specifically targets XLP, the Consumer Staples Select Sector SPDR Fund. This ETF tracks the performance of companies in the food and staples retailing, beverage, tobacco, and household product industries. XLP is an ideal candidate for mean-reversion strategies because these companies tend to have stable, predictable cash flows and lower volatility compared to tech or growth sectors. Because the underlying stocks are “defensive,” price swings are often temporary, leading the ETF to oscillate around its mean rather than embarking on long, runaway speculative trends.
Can you explain the conditions for entering a trade in this strategy?
To enter a trade, the strategy looks for a confluence of extreme short-term weakness. The primary criteria involve a low IBS value (often below 0.2 or 0.3) for both the current and previous trading sessions, suggesting that the asset has closed near its daily lows two days in a row. This is coupled with a Relative Strength Index (RSI) using a 5-period setting that must be below 50. This RSI filter ensures that the entry is not just a daily dip, but part of a broader short-term pull-back. To minimize slippage and capture the mean-reversion immediately, entries are typically executed market-on-close.
What is the primary focus of XLP Trading Strategies?
The primary focus of these strategies is the exploitation of short-term price inefficiencies within defensive equity sectors. Rather than following a “buy and hold” or trend-following approach, the strategy seeks to profit from the “rubber band effect”—where prices are stretched too far in one direction and must snap back to an average level. By focusing on the IBS indicator, the strategy prioritizes the structural behavior of how XLP trades intraday, capitalizing on the tendency of defensive stocks to be bought up by institutional investors after a sharp, short-term sell-off.
How are trades entered in XLP Trading Strategies?
Execution in this strategy is strictly rules-based and systematic. A trade is triggered only when the daily “close” price meets the multi-layered exhaustion criteria: specifically, the IBS must show that the price is finishing near the bottom of its range for two consecutive bars, and the 5-day RSI must confirm a lack of momentum. By entering at the close of the trading session, the strategy ensures it is capturing the most accurate data point for the IBS calculation, avoiding the “noise” and false signals that can occur during mid-day trading fluctuations.
Which indicator is utilized in XLP Trading Strategies to identify mean-reverting assets?
The cornerstone of this approach is the Internal Bar Strength (IBS) indicator, which is calculated using the following formula:
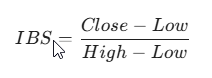
By using this formula, the strategy can numerically define “cheapness” within a single day’s range. While other indicators like Bollinger Bands or standard RSI are common, the IBS is uniquely suited for mean-reversion because it focuses on the internal structure of the price bar. It identifies when the market has “pushed” a defensive asset like XLP to an extreme intraday low, which historically serves as a reliable precursor to a bounce in price.
Trading Rules
We used the following trading rules for this backtest: