Center of Gravity Oscillator – Explained, Returns, Rules, Backtest
The Center of Gravity (COG) oscillator stands out in the crowded field of technical indicators as a rare predictive tool that aims to anticipate price movements rather than simply react to them. Unlike most lagging indicators that confirm trends after they’ve begun, the COG attempts to forecast turning points before they occur.
Can the Center of Gravity oscillator give you an edge in trading? Yes, when properly understood and implemented, the COG can provide valuable insights into potential price reversals and market momentum shifts.
Key Takeaways
- The Center of Gravity oscillator is a predictive, lag-free indicator designed to anticipate price reversals rather than confirm past movements
- Developed by John Ehlers, the COG uses weighted moving averages to calculate a “center of gravity” for price movements
- The indicator works best in range-bound markets and can struggle in strong trending conditions
- Signal line crossovers provide the primary trading signals, with additional confirmation from overbought/oversold levels
- Like all technical indicators, the COG should be combined with other tools and proper risk management for optimal results
- Related reading: top trading indicators list
What is the Center of Gravity Oscillator?
The Center of Gravity oscillator is a technical indicator that calculates the weighted center of price movements over a specified period. Think of it as finding the balance point of recent price action, similar to how you might find the center of gravity of a physical object.
The indicator was developed by John Ehlers, a prominent technical analyst who pioneered the integration of digital signal processing techniques in trading. Ehlers sought to create a tool that could predict market turning points rather than simply confirm them after the fact.
Center of Gravity Oscillator Backtest
We made the following trading rules:
- When the Center of Gravity Oscillator, closes above its 20-day exponential moving average, we go long; and
- When the Center of Gravity Oscillator, closes below its 20-day exponential moving average, we sell.
This is a typical trading strategy that works best on trading assets; thus, we test it on the gold price and Bitcoin.
Below is the equity curve for GLD from its inception until today:

The 166 trades returned on average 0.96% per trade. The win rate was 51% and the max drawdown was 29%. The strategy was invested 50% of the time.
This is the equity curve for Bitcoin from 2015 until today:
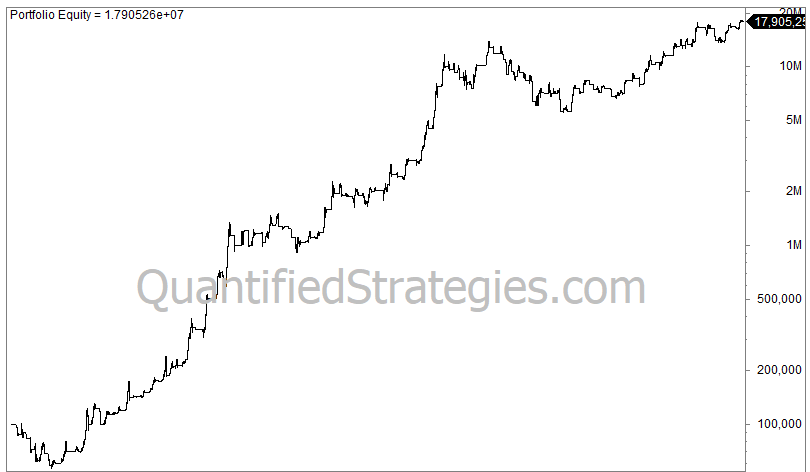
The 119 trades returned on average 5.8% per trade. The win rate was 57% and the max drawdown was 60%. The strategy was invested 49% of the time.
The Mathematics Behind the COG – How It’s Calculated
The COG calculation uses a weighted average formula where recent prices receive higher weights:
COG = Σ(Price × Weight) / Σ(Price)
Where:
- Price represents the closing price for each period
- Weight decreases as you go further back in time
- The sum covers the specified lookback period
Calculation Example
Let’s walk through a simple 5-day calculation:
Day 1 (most recent): Price = $108, Weight = 5
Day 2: Price = $106, Weight = 4
Day 3: Price = $104, Weight = 3
Day 4: Price = $102, Weight = 2
Day 5 (oldest): Price = $100, Weight = 1
Weighted Prices:
- Day 1: 108 × 5 = 540
- Day 2: 106 × 4 = 424
- Day 3: 104 × 3 = 312
- Day 4: 102 × 2 = 204
- Day 5: 100 × 1 = 100
Sum of Weighted Prices: 540 + 424 + 312 + 204 + 100 = 1,580
Sum of Weights: 5 + 4 + 3 + 2 + 1 = 15
COG = 1,580 ÷ 15 = 105.33
This COG value of 105.33 represents the weighted center of gravity for the 5-day price movement.
How to Interpret COG Signals
The Center of Gravity oscillator generates trading signals through several mechanisms:
Signal Line Crossovers
The primary signals come from crossovers between the COG line and a signal line (typically a moving average of the COG):
- Buy Signal: COG line crosses above the signal line
- Sell Signal: COG line crosses below the signal line
Overbought/Oversold Conditions
When prices deviate significantly from the COG line:
- Potential Reversal Up: Price well below COG suggests oversold conditions
- Potential Reversal Down: Price well above COG suggests overbought conditions
Momentum Analysis
The slope of the COG line indicates momentum strength:
- Rising COG: Bullish momentum
- Falling COG: Bearish momentum
- Flattening COG: Momentum weakening
Advantages of the COG Oscillator
Predictive Nature
Unlike most technical indicators that lag behind price movements, the COG aims to forecast turning points. This forward-looking characteristic can provide traders with earlier entry and exit signals.
Clear Visual Signals
The oscillator format makes it easy to spot potential trading opportunities through line crossovers and extreme readings.
Versatility
The COG can be applied across different markets (forex, stocks, commodities) and timeframes, making it suitable for various trading styles.
Customizable Parameters
Traders can adjust the lookback period and signal line settings to match their specific trading approach and market conditions.
Limitations and Considerations
False Signals in Choppy Markets
The COG’s sensitivity can lead to whipsaws and false signals during sideways or highly volatile market conditions. The indicator works best in markets with clear directional bias.
Complexity for Beginners
The mathematical foundation and proper interpretation of the COG may be challenging for novice traders to master initially.
Not Suitable for All Market Conditions
The COG performs poorly in strong trending markets where prices continue moving in one direction for extended periods. It’s primarily designed for range-bound conditions.
Implementation Variations
Different trading platforms may implement the COG calculation slightly differently, potentially leading to inconsistent results across systems.
Best Practices for Using the COG
Combine with Other Indicators
Never rely solely on the COG for trading decisions. Consider combining it with:
- Trend-following indicators (moving averages, MACD)
- Volume indicators
- Support and resistance levels
- Market sentiment measures
Focus on Market Context
The COG works best in range-bound markets. Before applying the indicator, assess whether the market is trending or consolidating.
Proper Risk Management
Like any trading tool, the COG should be used within a comprehensive risk management framework:
- Set appropriate stop losses
- Size positions according to your risk tolerance
- Diversify across multiple strategies and timeframes
Backtesting is Essential
Before implementing any COG-based strategy with real money, thoroughly backtest it across different market conditions and timeframes. Historical performance doesn’t guarantee future results, but it provides valuable insights into the strategy’s behavior.
COG vs. Other Oscillators
How does the COG compare to more traditional oscillators like RSI or Stochastic?
Advantages over traditional oscillators:
- Predictive rather than reactive
- Less prone to staying in extreme zones during trends
- Clearer turning point signals
Disadvantages compared to traditional oscillators:
- More complex calculation
- Less widely understood and used
- Fewer established best practices
Conclusion
The Center of Gravity oscillator represents an interesting approach to technical analysis, offering a predictive alternative to traditional lagging indicators. While it’s not a magic bullet for trading success, when properly understood and applied within the right market context, it can provide valuable insights into potential price reversals and momentum shifts.
The key to success with the COG, as with any technical indicator, lies in understanding its strengths and limitations, combining it with other analytical tools, and maintaining disciplined risk management. Remember that no single indicator can consistently predict market movements, and the COG should be viewed as one component of a comprehensive trading strategy.
For traders interested in exploring predictive indicators, the COG offers a mathematically sound approach backed by solid theoretical foundations. However, like all trading tools, it requires practice, backtesting, and careful application to achieve consistent results.