Composite Index Divergence Indicator (CIDI) – Rules And Strategy
In the ever-changing landscape of financial markets, traders sometimes refabricate old indicators to improve their market analysis and spot trend changes in time — one such indicator is the Composite Index Divergence Indicator (CIDI). What do you know about the CIDI?
The Composite Index is a momentum oscillator developed by Connie Brown to tackle the problem of inconsistent divergence signals by the RSI for predicting major trend reversals. It consists of a triple-smoothed derivative of the RSI and provides less noise and better swing amplitudes in sync with the price swings. Thus, any divergence of its swings from those of the price action generates a reversal signal.
In this post, we will take a look at most of the questions you may have about this indicator: what it is, how it works, and how you can use it to improve your trading strategies. Let’s dive in!
Key takeaways
- The Composite Index (also called CIDI) is a momentum oscillator developed by Connie Brown to improve on the RSI’s inconsistent divergence signals.
- It is based on a triple-smoothed derivative of the RSI, which reduces noise and better aligns indicator swings with price swings.
- The indicator focuses on identifying divergences between price action and momentum to signal potential trend or swing reversals.
- Unlike the traditional RSI, the Composite Index is unbounded, meaning it is not limited to the 0–100 range.
- The Composite Index was first introduced in a 1994 Market Technician Association Journal article titled “A New Approach for an Old Problem.”
- It was designed to be especially useful for traders using Elliott Wave Theory, where tracking and anticipating price swings is essential.
- Bullish divergence occurs when the indicator forms a higher low while price forms a lower low (or vice versa).
- Bearish divergence occurs when price forms a higher high while the indicator forms a lower high (or vice versa).
- Related reading: –Technical indicators list
What is the Composite Index Divergence Indicator (CIDI)?
The Composite Index is a momentum oscillator developed by Connie Brown to tackle the problem of inconsistent divergence signals by the Relative Strength Index (RSI) for predicting major trend reversals. It consists of a triple-smoothed derivative of the RSI and provides less noise and better swing amplitudes in sync with the price swings. Thus, any divergence of its swings from those of the price action generates a signal for trend or swing reversal.
The indicator was first introduced to the trading public in an article in a 1994 issue of the Market Technician Association’s Journal of Technical Analysis (Winter 1993-Spring 1994; 42: p45) titled: A New Approach for an Old Problem. A derivative of the RSI, the CIDI adds a momentum component to the conventional RSI, turning it into an unbounded momentum indicator — that is, it removes the usual 0 to 100 range of the traditional RSI so that the values can be anything.
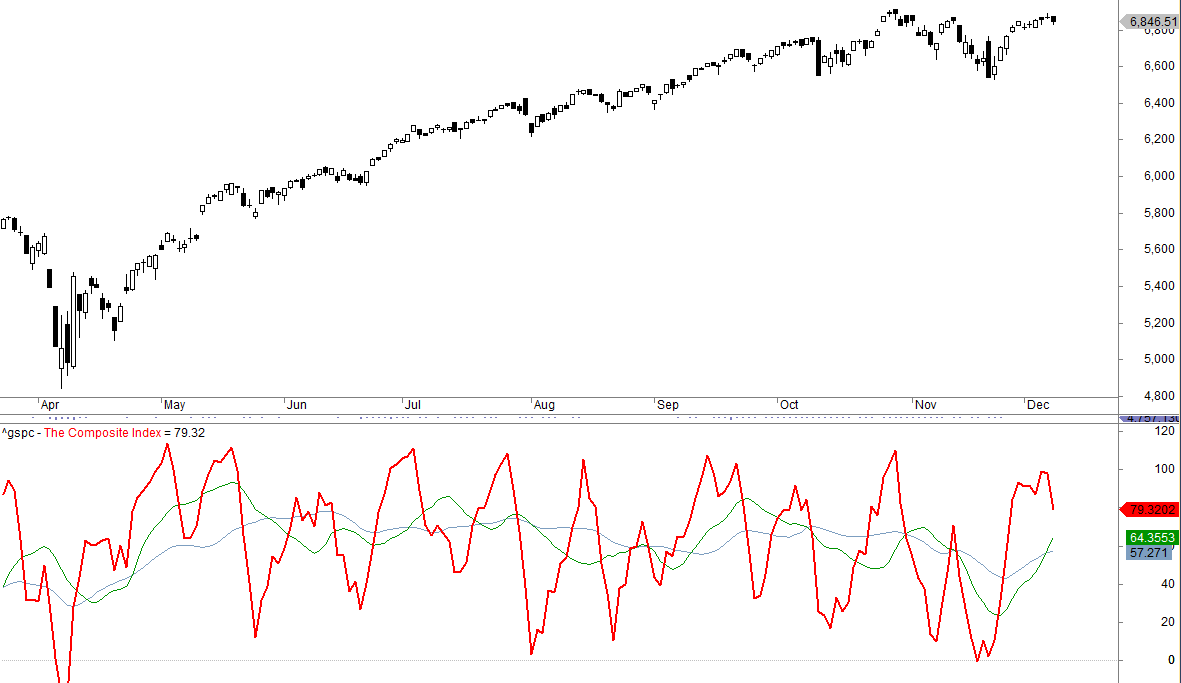
The CIDI was created to be very useful for traders who follow the Elliot Wave Theory where price swings are tracked and counted. Its divergence signals help to anticipate the reversal of one swing for the next swing to begin. A bullish divergence occurs when the indicator is making a higher low but the price action is showing a lower low or vice versa. A bearish divergence signal occurs when the price is making a higher high but the indicator is making a lower high or vice versa.
The bottom pane in the chart below shows an example of the CIDI:
How does the CIDI work in trading?
In trading, the CIDI works as a momentum oscillator that generates divergence signals. These signals can be used to track potential swing reversals, making them very useful for counting Elliot waves. The indicator is an improvement to the RSI, helping to solve the divergence problem observed in the RSI — the choppiness of the typical 14-period RSI makes it difficult to produce a reliable divergence signal.
The CIDI consists of 3 lines. The first line is created by embedding a 9-period Momentum in the traditional RSI and adding a 3-period SMA of a 3-period RSI to form the Composite Index — the primary line in the CIDI complex. The 9-period momentum in the Composite Index compares the most recent 14-period RSI value to the RSI value from 9 periods ago. This allows the resultant Composite Index Line to be ‘unbounded’ and, thus, not limited to the traditional RSI’s normalized range of 0 to 100.
The second line in the CIDI complex is the Fast SMA Line, which is a 13-period SMA of the Composite Index Line, while the third line, or the Slow SMA Line, is a 33-period SMA of the Composite Index Line.
However, it is the Composite Index Line that generates the divergence signals that characterize the CIDI. A bullish divergence occurs when the indicator is making a higher low but the price action is showing a lower low or vice versa, while a bearish divergence signal occurs when the price is making a higher high but the indicator is making a lower high or vice versa.
Composite Index Divergence Indicator (CIDI) trading strategy- rules, settings, returns, and performance
Let’s backtest a trading strategy that uses the Composite Index Divergence Indicator – complete with trading rules and settings.
We make the following trading rules:
- When the CIDI breaks below 10, we go long at the close; and
- We sell when the close ends higher than yesterday’s high or after 7 trading days.
Commissions and slippage of 0.03% per trade are included.
This is the equity curve for QQQ from inception until today:

There are 228 trades, the average gain per trade is 1%, and the win rate is 76%. Max drawdown is 17%.
What are the benefits of using CIDI?
The benefits of using CIDI include:
- The indicator generates bullish and bearish divergence signals of both the classical and hidden types, which traders can use to anticipate swig reversals.
- It helps to track price swings in Elliot wave counting, making it very useful to traders who use the Elliot Wave Theory.
- Its readings are unbounded, so it can move as high or low as the price action permits.
- Its slow SMA line may show the direction of the main trend.
How to set up CIDI on your trading platform?
To set up the CIDI on your trading platform, you first check whether the indicator is preinstalled on your platform so you can simply double-click it to attach it to the chart. If it isn’t one of the preinstalled indicators, you have to get a programmer to create a custom version of the indicator for your trading platform.
When it is installed, go to the indicator section of the platform to find it. Double-click on it to attach it to the chart. A box may pop up where you input your preferred settings.
What are the key features of the CIDI?
The key features of the CIDI are as follows:
- The Composite Index Line: This is the primary indicator line that generates the divergence signals. A bullish divergence signal occurs when the price makes a lower low but the indicator makes a higher low (classical divergence) or the price makes a higher low but the indicator makes a lower low (hidden divergence). The opposite is true for bearish divergences.
- The Fast SMA Line: This line is obtained by calculating a 13-period SMA of the Composite Index Line. While some analysts may use it for a crossover signal, it is not really important in the divergence signal.
- The Slow SMA Line: This line is obtained by calculating a 33-period SMA of the Composite Index Line. Some analysts may use it to gauge the direction of the overall trend. However, it is not really important in the divergence signal.
How does CIDI indicate market trends?
The CIDI indicates market trends via its SMA lines, especially the Slow SMA Line, which is a 33-period SMA of the Composite Index. Since it is moving slowly and doesn’t swing about like the Composite Index Line, the Slow SMA Line can help identify the trend.
The Composite Index Line, on the other hand, only tracks the individual price swings, generating divergence signals in anticipation of reversals. However, the swings on a much higher timeframe can be a trend on a lower timeframe. So, with a multi-timeframe analysis, the Composite Index Line can identify a lower timeframe trend.
Can CIDI predict price movements accurately?
Yes, the CIDI can predict price movements accurately, but as with most indicators, it cannot do it all the time. No indicator predicts price movements accurately all the time. There is no Holy Grail indicator out there.
Any indicator can predict price movements accurately some of the time, but never all the time. It is the same with the CIDI — its divergence signals have been shown to have a very high probability of success in predicting swing reversals of about 35% on the monthly timeframe over a test period of 1995 to 2015.
What are the differences between CIDI and other indicators?
The differences between CIDI and other indicators include:
- Unbounded values: The CIDI embeds the momentum formula into the traditional RSI to make its value unbounded. So, its value can go as high or low as the price movement permits. This is unlike other oscillators, like the RSI and stochastic, which have fixed value ranges of 0 to 100.
- Divergence signals: The CIDI’s primary signals are the bullish and bearish divergence signals. Other indicators tend to generate crossover and overbought/oversold signals more than the divergence signals.
How to interpret CIDI signals effectively?
To effectively interpret CIDI signals, you have to consider the timeframe and the direction of the trend. If you are using the indicator to identify and trade price swings on the lower timeframes, you will need to consider the direction of the main trend so you don’t trade against the trend.
You can get that from a trend indicator. Alternatively, you can do a multi-timeframe analysis where you use the Composite Index divergence to identify a swing reversal on a higher timeframe and then go to a lower timeframe to find an entry in the direction of the emerging swing of the higher timeframe.
What are the limitations of using CIDI?
The limitations of using CIDI include:
- It can still give false signals
- It works better on the higher timeframe than on the lower timeframe — the backtesting result provided by the author was done on the monthly timeframe
- You may need to do a multi-timeframe analysis if you want to use it alone
How to integrate CIDI into your trading strategy?
To integrate CIDI into your trading strategy, you have to understand how the indicator works so you know how to effectively apply it to an existing strategy or use it to create a new strategy. How you use the indicator will depend on your trading approach.
If you like to trade price swings, you can use the divergence signals to identify the beginning of a new swing so you can trade along. If you are a position trader, you may combine it with a trend analysis or use a higher timeframe divergence to anticipate the next trend to ride.
What timeframes work best with CIDI?
The timeframes that work best with CIDI will depend on your trading style and the results of your backtesting. The author backtested the indicator on the monthly timeframe and showed that it performed very well on that timeframe. However, other timeframes have not been tested to know how it performs.
If your style is day trading, you will have to backtest it on intraday timeframes, such as the hourly, 30-minute, 15-minute, and even 5-minute timeframes. If you are a swing trader, you will have to backtest it on the daily, 8-hourly, and 4-hourly timeframes.
Is CIDI suitable for beginner traders?
The CIDI can be suitable for beginner traders if they understand how it works and know how to use it to create simple but robust trading strategies. A beginner should start by learning about the indicator.
After that, they can open a demo account to practice with it until they are comfortable creating strategies with it, backtesting the strategies, and implementing them in real time. They may also have to enroll in a trading course to get a quality education.
What are common mistakes when using CIDI?
The common mistakes when using CIDI include the following:
- Not formulating a reliable strategy with clear entry and exit points
- Not doing a multi-timeframe analysis when they want to use the indicator as a standalone trading strategy
- Not combining the indicator with other indicators or other forms of analysis to improve its signals
- Not backtesting your trading strategy before applying it in the market
- Trading without a proper risk management plan
How to customize CIDI settings for your needs?
To customize CIDI settings for your needs, you will have to understand the type of trader you are and the strategy to use. Next, you create a trading strategy based on the indicator and backtest it. During the backtesting, you experiment with different settings to find the ones that work best for the market you are trading.
When you find the settings that suit your needs, retain them for your strategy and the market. However, you may need to periodically evaluate the performance of the strategy to know when you need to tweak the settings to align with the current market condition.
How reliable is CIDI in different markets?
The CIDI can be reliable in different markets if you apply it the right way. This means understanding each market and fashioning a strategy that suits the different markets. You will also backtest the strategies in those markets to know the right indicator settings for each market.
With this, you will be trading each of the different markets with a CIDI strategy that has an edge in its specific market.
What assets can be traded using CIDI?
Any financial assets can be traded using CIDI since the indicator makes use of only the price data and all financial assets display their price data on their charts. The CIDI is unlike volume-based indicators, which cannot be used in markets where there is no reliable volume data, such as the spot forex market.
As a price-based indicator, it can be used in all assets.
How to confirm CIDI signals with other indicators?
To confirm CIDI signals with other indicators, you have to choose indicators that complement the Composite Index Divergence Indicator. Since the CIDI’s primary signals are divergence signals, which are used to identify the beginning of new price swings, the indicator should be combined with a trend indicator, such as the moving average, when using it on the lower timeframes.
The moving average can show the direction of the main trend so you can look for CIDI divergence signals in that direction. For instance, if the trend is up, you only look for CIDI bullish divergence signals. You can also use volume indicators to confirm the signals.
What are the best practices for using CIDI?
The best practices for using CIDI include:
- Trading only in the direction of the main trend or the swing direction in a much higher timeframe
- Doing a multi-timeframe analysis if you want to use the indicator as a standalone trading strategy
- Combining the indicator with trend indicators to trade individual price swings in the trend direction
How to backtest CIDI for your trading strategy?
To backtest the CIDI for your trading strategy, follow these steps:
- Identify and study the markets you want to backest your CIDI-based trading strategy.
- From your findings in the market study, create your CIDI trading strategy and state the parameters or settings to experiment with.
- Gather the historical data you need for the backtesting and divide the data into in-sample and out-of-sample data.
- Convert the strategy into a trading algorithm if possible.
- Run your backtesting on the in-sample data and optimize with the out-of-sample data, adjusting your parameters as needed.
- Evaluate the results of your backtesting
What do users say about the CIDI?
Users haven’t said much about the CIDI since the indicator is still relatively new to the market and not many traders are aware of it, let alone use it for their trading strategies.
However, from the backtesting result posted in the author’s study of the CIDI, the indicator performed very well on the monthly timeframe for the study period — 1995 to 2015. For one stock index, six out of the seven signals produced 35% or more price retracement, and the seventh one produced a 30% retracement.
How does CIDI handle market volatility?
How the CIDI handles market volatility depends on whether the market is trending or range-bound. While the Composite Index Line generally gets choppier in volatile markets, the signals are better if the market is trending. In a range-bound market, the performance of the CIDI signals will depend on the size of the price range.
If the range is big enough for swing trading, the divergence signals can be useful in trading the market from one end of the range to the other.
What are the latest updates to the CIDI?
The latest updates to the CIDI will include adding the indicator in more trading platforms. The indicator is already on TradeStation, TradingView, and a few other platforms. If it is preinstalled on a platform and the codes are available, traders can customize it to suit their different ways of trading.
How to troubleshoot common CIDI issues?
How you troubleshoot common CIDI issues will depend on your trading platform and its indicator coding methods. Check your trading platform for guidance if you have any issues with the CIDI code.
Where can you learn more about the CIDI?
You can learn more about the CIDI from Connie Brown’s article in the 1994 issue of the Market Technician Association’s Journal of Technical Analysis (Winter 1993-Spring 1994; 42: p45) titled, “A New Approach for an Old Problem”, where she first explained the nature of the indicator.
You can also read her 1999 book, “Technical Analysis for the Trading Professional”, where she explains more about the indicator.