
EURO STOXX 50 Futures Pullback Setup

Today, for the first time, we are publishing a futures strategy called EURO STOXX 50 Futures Pullback Setup.
EURO STOXX 50 Futures Pullback Setup
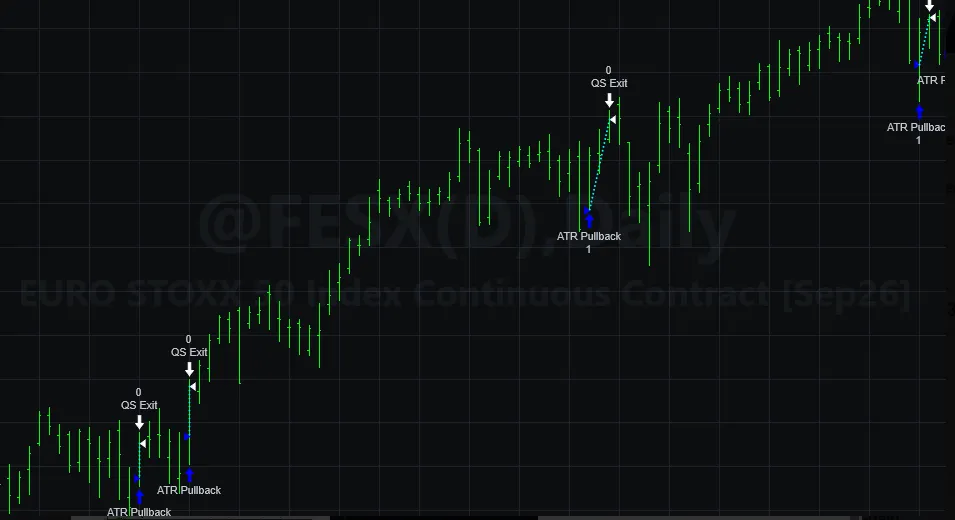
We start with a screenshot:
The equity curve of all the trades looks like this:
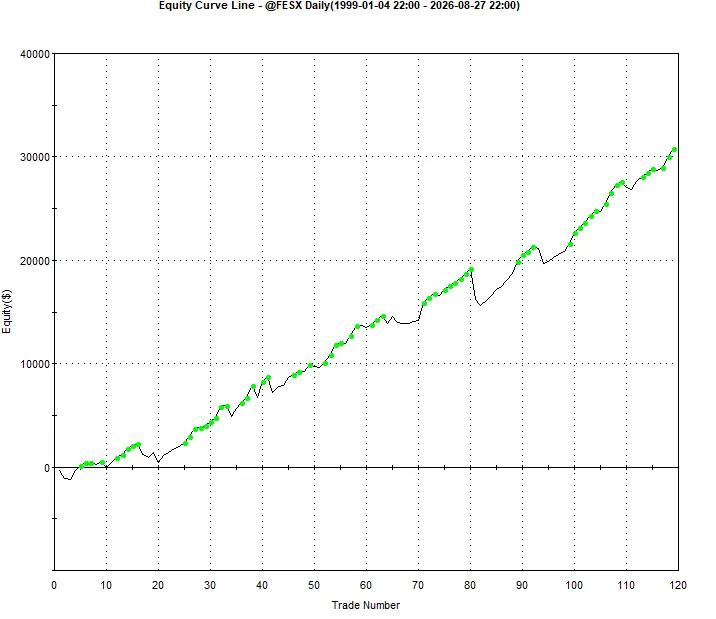
The green dots signal a new equity high.
Performance
Backtest since 1999:
- 119 trades
- 75.6% winners
- Profit factor: 2.83
- Average trade: +$259 per contract
Trading Rules
🔒 These trading rules are for members only.