Republican Or Democratic President – What Is Best For Stocks?
This blog post explores fascinating new evidence from a research paper titled “From Red to Blue: The Long-Run Inversion of Political Cycles and Stock Market Returns Over 153 Years” by Han, Lu, Xu, and Zhou. The paper documents a fundamental shift in how U.S. political cycles have shaped stock market performance, demonstrating that the common wisdom about which party is better for stocks is highly dependent on history.

Using over 150 years of U.S. data (1872–2024), researchers documented a structural inversion in the partisan return gap. In simple terms, the party associated with higher stock returns dramatically reversed around the time of the Great Depression in 1929.
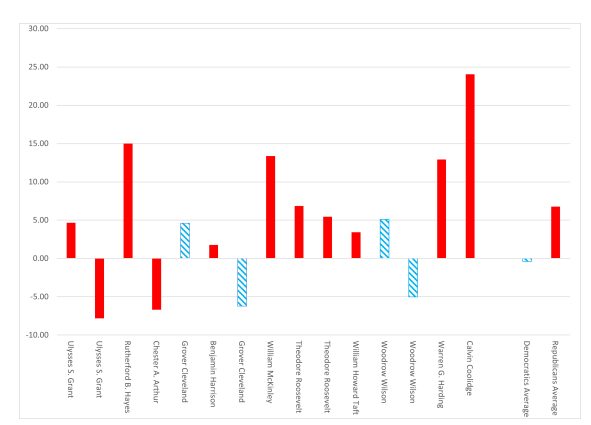
Era 1: The Republican Premium (1872–1928)
Before the Great Depression of 1929, the stock market showed a clear “Republican premium”. This era largely reflected a period of laissez-faire capitalism, industrial expansion, and the gold standard, where prosperity was tied to business confidence and consumption growth.
• The Returns: During this early period, excess returns (stock market returns minus the risk-free rate) were approximately 7% higher under Republican presidents. The average annual excess return was 6.78% under Republicans, compared to a negative average of -0.39% under Democrats.
• The Historical Context: Republicans were dominant from the Civil War through the 1920s, generally championing low taxes, sound money, and limited federal intervention. Pre–New Deal Democrats were often a decentralized coalition of states’ rights conservatives and agrarian populists skeptical of centralized economic policy.
• Why Stocks Performed Better: This performance is consistent with the Consumption-Risk Channel. Republican administrations were associated with stronger consumption growth and returns that were highly correlated (or “procyclical”) with that consumption growth. Essentially, when things were good, the stock market boomed under Republican leadership, demanding a higher risk premium to compensate investors.
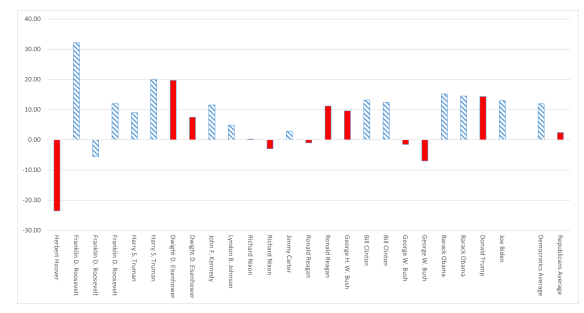
Era 2: The Democratic Premium (1929–2024)
The onset of the Great Depression and Franklin D. Roosevelt’s New Deal triggered a profound ideological realignment in American politics. Since 1929, the pattern has been reversed, confirming the famous “presidential puzzle” documented in earlier literature.
• The Inversion: Since 1929, Democratic presidents have been associated with a large and statistically significant excess return premium of more than 9% (specifically, 9.53 percentage points).
• The Returns: The average annual excess return under Democratic administrations is a substantial 11.96% (or approximately 12.0%), significantly exceeding the 2.43% (or 2.40%) averaged under Republican administrations. This Democratic premium remains large and statistically significant even after controlling for macroeconomic factors like inflation, GDP growth, and recessions.
• The Historical Context: The New Deal established federal responsibility for social welfare, economic stability, and countercyclical policy as central tenets of the Democratic identity.
• Why Stocks Performed Better: The consumption-risk model fails to explain the post-1929 Democratic premium. Instead, the modern pattern is explained by the Risk-Aversion Channel. This theory suggests that investors demand higher expected returns during periods of elevated risk aversion, which often coincide with the election of Democratic presidents, who are often elected during times of crisis due to their emphasis on social insurance and economic stabilization. The research supports this, showing that the partisan return gap widens when risk aversion is higher.
The Bottom Line: Context is Everything
The study demonstrates that the evolution of political ideology systematically shapes asset prices. The relationship between political cycles and stock returns is not static but rather time-varying and regime-dependent.
The dramatic reversal confirms a two-regime interpretation of U.S. financial history:
1. Before 1929: The Republican premium was rationalized by standard asset pricing models, driven by consumption growth and procyclical returns.
2. Since 1929: The Democratic premium is primarily driven by time-varying risk aversion, reflecting the ideological shift of the Democratic Party and the enduring legacy of the New Deal era.
This research highlights that political economy explanations for stock market performance must account for these historical regime shifts. The 1929 break is seen as a natural breakpoint that is both historically justified and empirically supported by the data, reflecting how political and economic forces interact to shape long-horizon market outcomes.
Simplified Analogy
Please think of the stock market’s reaction to political parties like an old car: before the Great Depression (1929), the engine ran best (high returns) when Republican mechanics were in charge, specifically because their policies fueled consumption directly and visibly.
After 1929, the car got a completely new operating system (the New Deal ideology), and now, when the car starts struggling or the roads get dangerous (high risk aversion), investors feel safer and demand better performance when Democratic drivers take the wheel. The car itself – the market – responds differently depending on the historical era and underlying economic conditions.