

The Best Calendar Days Of The Year To Trade Stocks (Statistics, Data Analysis)

We did a backtest where we optimized the month and calendar day to find the best calendar days for the S&P 500.
Key Takeaways
- Backtest identifies best calendar trading days
- Strategy uses overnight close-to-close trades
- Calendar days differ from trading days
- October calendar day 10 performs best
- Average overnight gain reaches about 1%
- Strong bias from October through April
- Seasonality significantly affects short-term returns

We backtested the result by entering at the close of calendar day N and selling at the close the next day. In other words, this is an overnight trade.
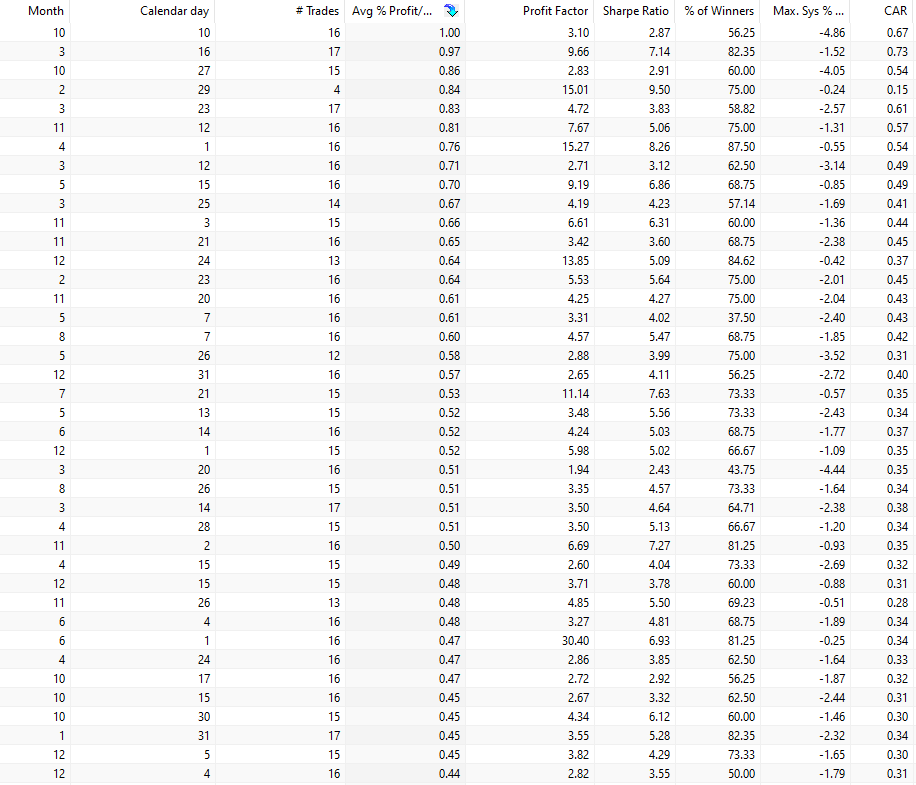
The table below contains the results.
Row one says that calendar day 10 in October is the best with an average gain of 1% from the close of calendar day 10 to the next calendar day.
The results are biased toward the strongest period for stocks: from October to the end of April:
FAQ:
What does the backtest on calendar days for the S&P 500 involve?
The backtest on calendar days for the S&P 500 involves optimizing the month and calendar day to identify the best-performing calendar days for trading. The strategy enters the market at the close of a specific calendar day and exits at the close the following day, making it an overnight trade.
How was the backtest conducted, and what were the optimization parameters?
The backtest was conducted by optimizing the month and calendar day. This process involved testing various combinations to determine the most favorable calendar days for trading the S&P 500. The optimization aimed to find patterns and trends in specific timeframes.
What are the key results of the backtest, and how are they presented in the table?
The key results of the backtest are presented in a table. Each row of the table represents a specific calendar day, and the data includes the average gain from entering at the close of that day to the next calendar day. For example, if row one indicates that calendar day 10 in October is the best, it means an average gain of 1% from the close of day 10 to the close of the next calendar day.