
What Does A Gap Down Mean? Is It A Buying Opportunity?

Gaps happen frequently in financial assets, both up and down, and in some markets more frequently than others.
This article looks at gaps down. What does a gap down mean? Is a gap down a buying opportunity? We define two types of gaps down and we look at the performance when this happens.
Key Takeaways
- Gap down means opening below the previous day’s low.
- Gap down days often signal short-term market weakness.
- Some gap downs create profitable buying opportunities.
- Nasdaq gap-down strategies outperformed similar S&P 500 tests.
- Buying gap-down closes showed strong historical win rates.
- Mean reversion often drives post-gap recovery moves.
- Results vary across different markets and assets.
- Backtesting helps validate gap-down trading strategies.
What is a gap down? What does a gap down mean?
We divide a gap down into two different gaps (other traders might have different definitions):
- When your asset opens lower than yesterday’s low, you have a gap down opening. There is an area between those two points that has not been traded.
- Also, when the high of the day is lower than yesterday’s close, we have a gap down day.
The two of them are different. Let’s look at the performance in both of the gaps down. We concentrate on the S&P 500 and Nasdaq. The results below might be worthless or better on other financial instruments.
Gap down opening performance
We buy any opening that is below yesterday’s low and we sell on the close. To avoid potentially bad prints in the ETF SPY, we test on ES futures. The equity curve looks like this:
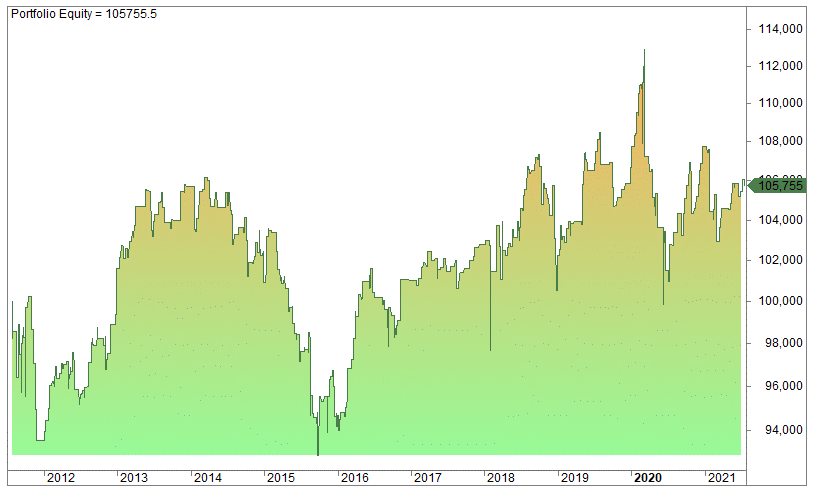
We don’t bother mentioning the numbers: The 401 trades over the last ten years resulted in pretty random numbers, albeit slightly better than any random day from open to the close.
We tested the same strategy on gold, silver, and oil futures, but got even more random numbers.
However, on Nasdaq, it seems to perform much better. We added one simple indicator and we got this equity curve:
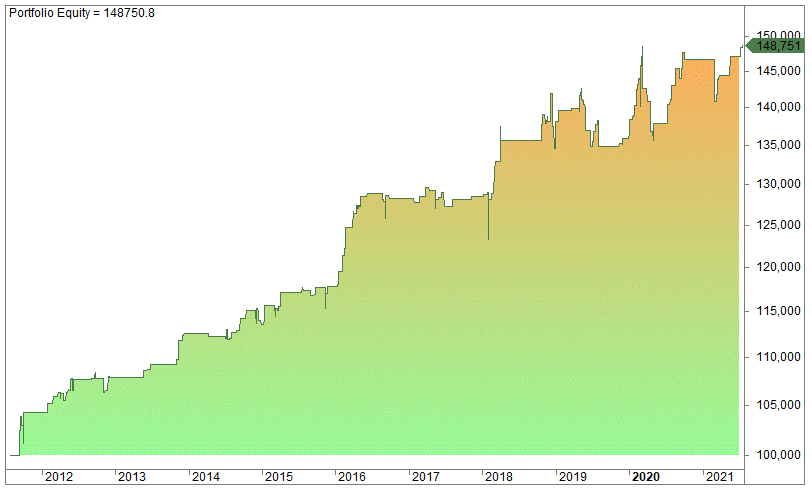
There are 180 trades and the average gain is 0.23% per trade. This shows some promise, so we are reluctant to reveal the variable we used.
A gap down day and performance
What happens if you buy the close of every gap down day? We repeat that a gap down day is when today’s high is lower than yesterday’s close. Let’s test on SPY:
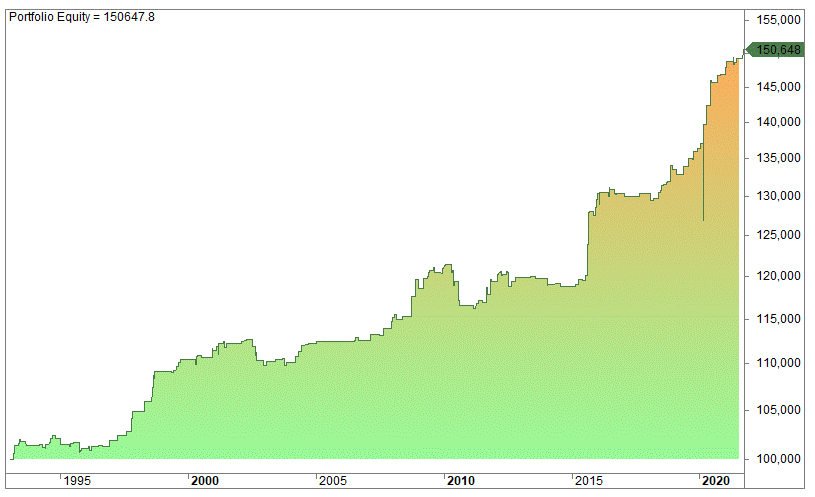
We buy at the close and sell at the open the next day (to exit on the open works better than on the close). We get these numbers:
- 213 trades between 1993 and September 2021.
- The average gain is 0.2%.
- The win ratio is 67.5%
- The average winner is slightly bigger than the average loser.
- Max drawdown is 7.5.
- The profit factor is 2.2.
These are pretty good numbers.
