

What Is the Best RSI Oversold Level? We Tested 1 Through 50

Everyone knows the rule:
RSI below 30 means oversold.
It appears in trading books, charting platforms, courses, YouTube videos, and countless articles.
But there is an obvious question that is asked surprisingly rarely:
Why 30? Why not 29? Or 20? Or 10?
We decided to test it.
Instead of accepting the traditional RSI oversold level, we tested every threshold from 1 through 50 on SPY using more than 33 years of daily market data.
The result was surprisingly clear. RSI 30 worked. But it was nowhere near the most efficient oversold level.
And there was another surprise buried inside the results.
The highest profit factor did not necessarily identify the best RSI level. That distinction matters!
The RSI Test
We wanted to isolate one variable: the RSI oversold threshold.
The basic test used:
- SPY daily data
- RSI with a 2-day lookback
- RSI thresholds from 1 through 50
- SPY above its 200-day moving average
- Entry at the next session’s open
- Exit after a short-term rebound
- No overlapping positions
Everything remained the same except the RSI threshold.
That means RSI below 1 was one backtest.
RSI below 2 was another.
Then 3, 4, 5, and so on until RSI below 50.
In total, we examined 50 different definitions of “oversold.”
The SPY data covers February 1993 through September 2026.
At First, RSI 1 Appeared to Win
When we ranked the tests by profit factor, one result immediately jumped off the screen.
RSI below 1 produced a profit factor of 6.56.
That sounds extraordinary. But there was a problem. It generated only 13 trades during more than three decades.
That is nowhere near enough evidence to conclude that RSI 1 is some magical threshold.
If the sample is tiny, one or two trades can dramatically change the result.
So rather than declaring RSI 1 the winner, we looked for a region where three things came together:
- A strong profit factor
- A reasonable number of trades
- Similar results at neighboring RSI levels
That led us somewhere very different.
The Practical Sweet Spot Was Much Higher Than 1, But Much Lower Than 30
The strongest practical area appeared roughly between RSI 5 and RSI 16.
Here are some representative results:

The pattern is more important than any one number.
As we loosened the definition of oversold, we got more trades.
But the quality of those trades generally deteriorated.
That is exactly what we would expect if very low RSI readings contain information that ordinary “RSI below 30” readings do not.
RSI 9 Was the Full-Sample Standout
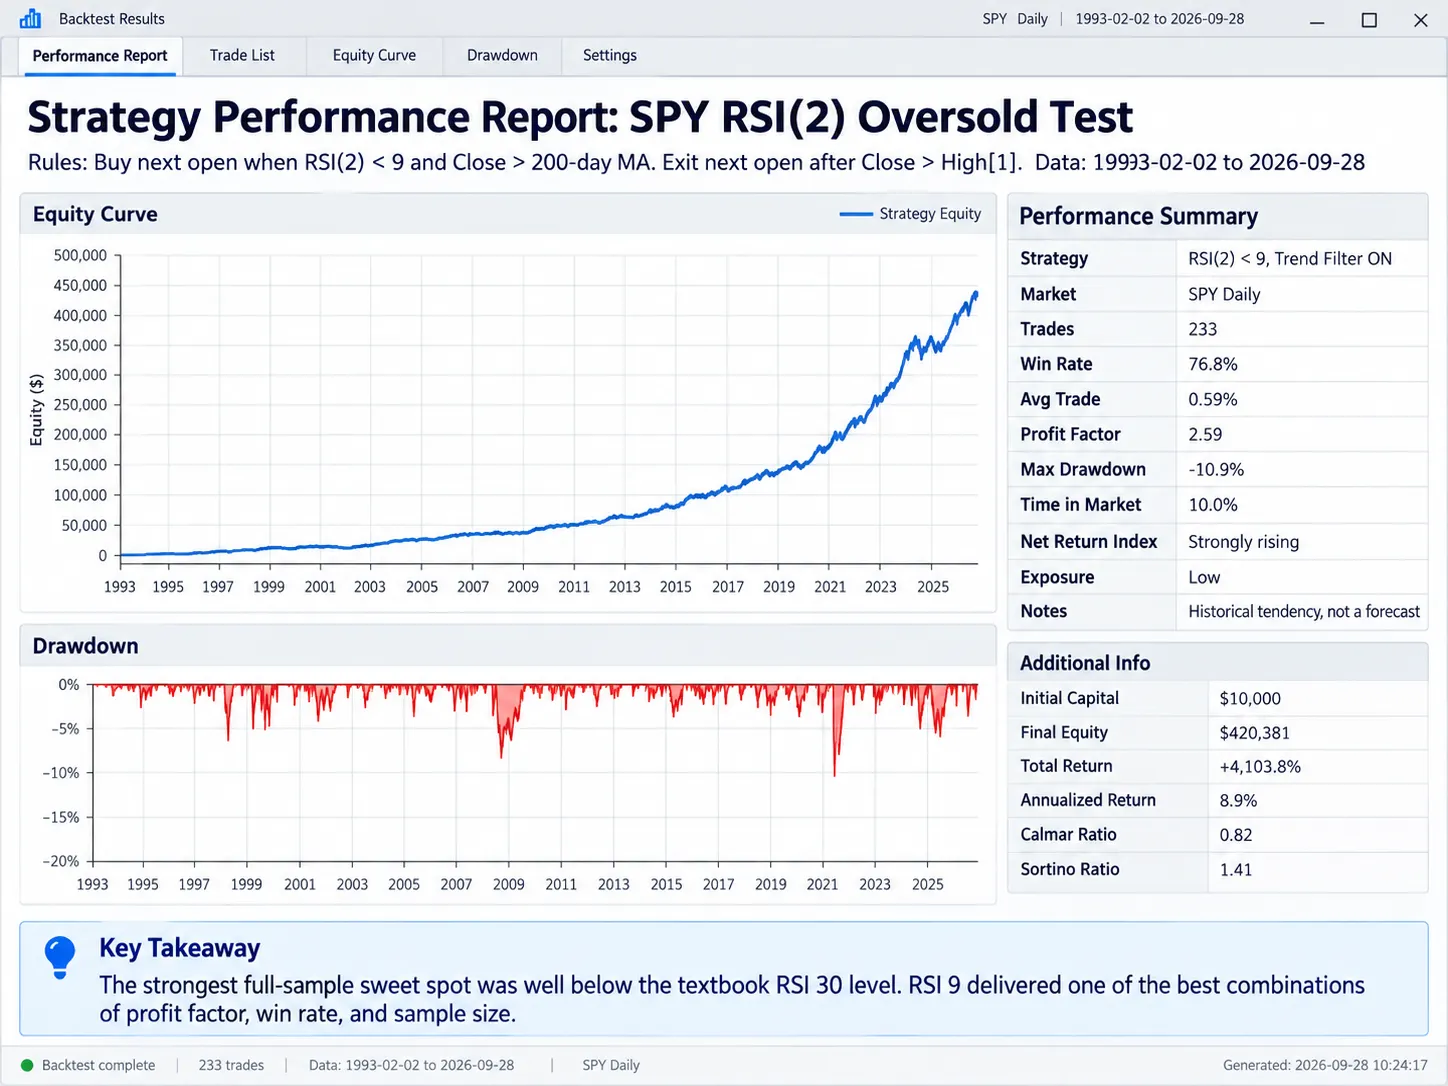
Among thresholds with a meaningful sample size, RSI below 9 produced one of the strongest combinations.
The test generated:
- 233 trades
- 76.8% winners
- 0.59% average gain per trade
- Profit factor of 2.59
- Maximum drawdown of 10.9%
- Only about 10% time in the market
Compare that with the traditional RSI 30 threshold.
RSI below 30
- 613 trades
- 70.3% winners
- 0.33% average gain per trade
- Profit factor of 1.84
- Maximum drawdown of 13.0%
- 27.4% time in the market
RSI 30 produced far more signals.
But those signals were weaker.
The average trade at RSI 9 was approximately 81% larger than at RSI 30.
That is a substantial difference.

Does That Mean RSI 9 Is the “Best” RSI Level?
Not necessarily.
This is where the results become more useful.
RSI 9 maximized one type of efficiency.
But a trader who wants more opportunities might reasonably prefer something around RSI 14 to 16.
Consider RSI 15:
- 383 trades
- 74.9% winners
- 0.47% average trade
- Profit factor of 2.34
- Maximum drawdown of only 9.4%
Compared with RSI 9, you get about 64% more trades.
The individual trade is weaker, but the overall profile remains strong.
This suggests there is no single magical oversold number.
Instead, there appears to be a historical sweet spot.
Very low RSI levels provide stronger selectivity. Slightly higher thresholds provide more trading opportunities.
Once we move toward the traditional 30 level and beyond, the extra trades increasingly appear to dilute the edge.
The Most Important Lesson: “Oversold” Is Not Binary
Trading textbooks often present RSI as though there were two states:
Above 30: normal
Below 30: oversold
Our results suggest that this loses useful information.
An RSI reading of 29 and an RSI reading of 4 may both technically be “oversold” under the traditional definition.
Historically, however, they have not behaved the same way.
The deeper SPY became oversold, the stronger its short-term mean-reversion tendency generally became.
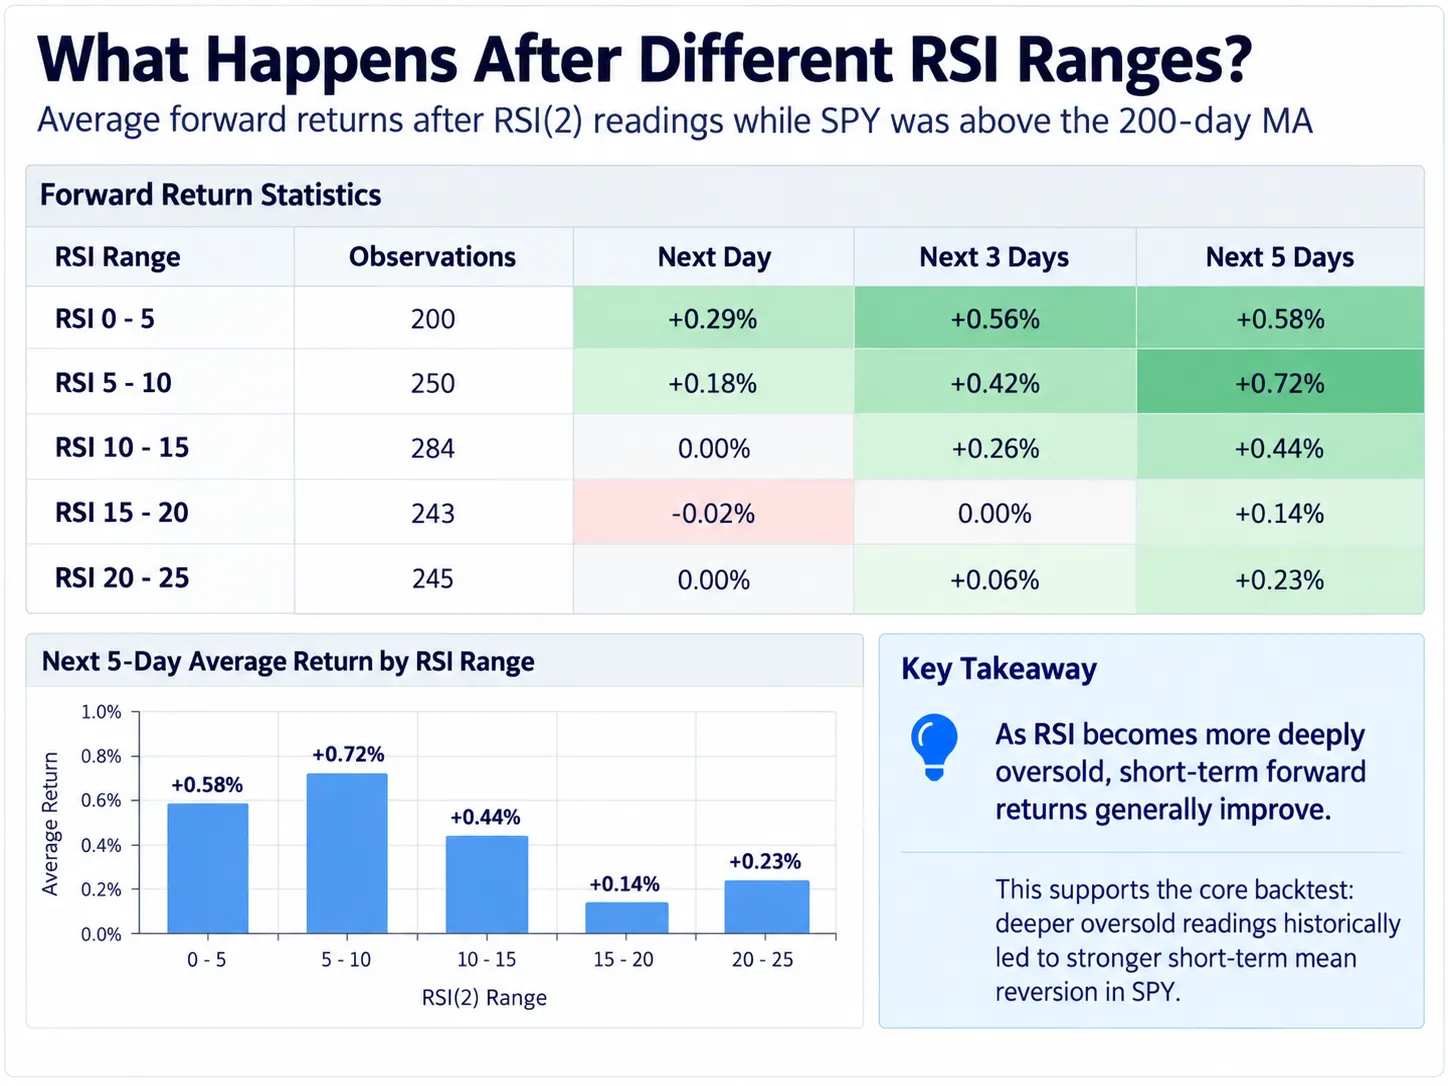
That can also be seen without using the strategy rules at all.
We simply grouped RSI readings and measured SPY’s subsequent returns while SPY was above its 200-day moving average.

The strongest five-day return occurred after RSI readings between 5 and 10.
Again, this points toward the same general area.
But Could This Just Be an Optimized Exit?
This is an important objection.
Perhaps RSI 9 looks unusually good because it happens to fit our particular exit rule.
So we changed the exit.
Then we changed it again.
And again.
The exact winning threshold moved around, which is what we would expect.
But the important part did not change.
Low RSI thresholds continued to perform well.
For example:
Three-day holding period
RSI 5 produced:
- 133 trades
- Profit factor 2.50
Five-day holding period
RSI 6 produced:
- 164 trades
- Profit factor 2.94
RSI 8 produced:
- 211 trades
- Profit factor 2.62
RSI 9 produced:
- 238 trades
- Profit factor 2.57
Exit when RSI(2) rises above 50
RSI 6 produced:
- 163 trades
- Profit factor 2.77
RSI 9 produced:
- 241 trades
- Profit factor 2.54
Exit when RSI(2) rises above 70
The results became even stronger.
RSI 8 produced:
- 205 trades
- Profit factor 3.51
RSI 9 produced:
- 229 trades
- Profit factor 3.48
The exact optimum changed depending on the exit.
But the broader conclusion survived.
The strongest thresholds repeatedly clustered well below RSI 30.
That is more convincing than finding one isolated optimized number.

What Happens If We Remove the 200-Day Moving Average?
The 200-day moving average filter was another possible source of bias.
Maybe the RSI effect only exists because we excluded bear markets.
So we removed the filter.
RSI below 9 without the 200-day moving average produced approximately:
- 357 trades
- Profit factor 2.15
- 0.58% average trade
- Maximum drawdown of 14.6%
The result became weaker.
But it did not disappear.
That suggests the 200-day moving average improves the quality of the setup, but it does not create the entire RSI effect.
This makes intuitive sense.
Short-term mean reversion has historically behaved differently depending on the broader market regime.
Buying an oversold pullback during a long-term uptrend is not the same situation as buying an oversold market during a major bear trend.
Then We Found Something Even More Interesting
Up to this point, you might conclude that RSI 9 is simply the best level.
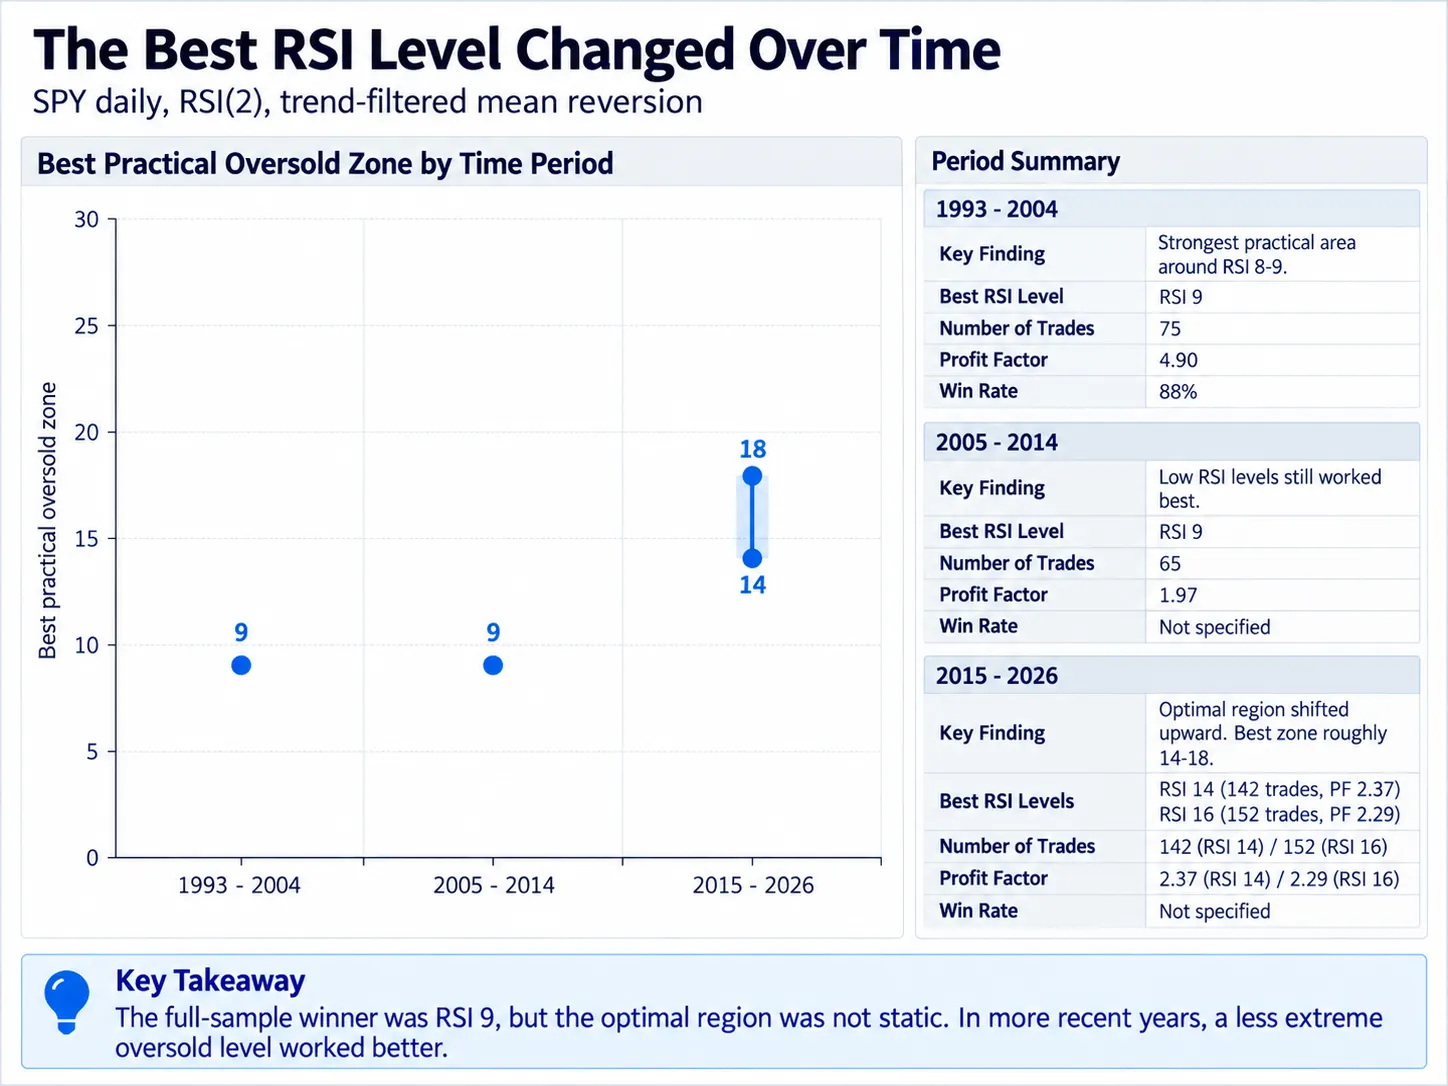
But when we split the backtest into different periods, the story changed.
1993 to 2004
The strongest practical area was around RSI 8 to 9.
RSI 9 produced:
- 75 trades
- Profit factor 4.90
- 88% winners
That is an exceptionally strong historical result.
2005 to 2014
The edge became weaker.
RSI 9 produced:
- 65 trades
- Profit factor 1.97
Still profitable, but nowhere near the first period.
2015 to 2026
Now something changed.
The strongest region shifted upward.
RSI 14 produced:
- 142 trades
- Profit factor 2.37
RSI 16 produced:
- 152 trades
- Profit factor 2.29
The strongest practical area in the recent period appeared closer to RSI 14 to 18.
The “Best” RSI Oversold Level Is Not Static
This is perhaps the most important finding in the entire test.
If we optimized the full history and stopped there, RSI 9 would look like the obvious answer.
But markets change.
The SPY market of the 1990s is not identical to the SPY market of the 2020s.
Liquidity changes.
Market structure changes.
Volatility changes.
The speed at which traders react changes.
So it should not surprise us that the exact threshold changes as well.
The robust conclusion is therefore not:
RSI 9 is the magic number.
A better conclusion is:
Historically, SPY’s strongest RSI(2) mean-reversion zone has generally appeared much deeper into oversold territory than the traditional RSI 30 level.
And within that broad zone, the best exact threshold has varied over time.
So Is RSI 30 Wrong?
No.
That would be too strong a conclusion.
RSI 30 still produced profitable historical results in this test.
It also generated far more trades.
But if the objective is to identify unusually stretched short-term conditions in SPY, RSI 30 appears to be a relatively loose definition of oversold.
The difference is substantial.
RSI below 9
Profit factor: 2.59
Average trade: 0.59%
Win rate: 76.8%
RSI below 30
Profit factor: 1.84
Average trade: 0.33%
Win rate: 70.3%
The traditional setting generated more signals.
The deeper setting generated historically stronger signals.
That is the trade-off.
What We Learned From Testing All 50 RSI Levels
There are five conclusions we think matter most.
First, RSI 30 is not useless.
It worked historically.
But it did not produce the strongest results.
Second, deeper oversold readings historically produced stronger mean reversion.
The strongest practical region generally appeared below roughly RSI 10 to 15 in the full sample.
Third, the highest profit factor can be misleading.
RSI below 1 produced a spectacular 6.56 profit factor, but only 13 trades.
Sample size matters.
Fourth, there is a trade-off between selectivity and opportunity.
RSI 9 produced stronger individual trades.
RSI 14 to 16 produced more trades while retaining a strong edge.
Fifth, the optimal level changed over time.
The older sample favored extremely low RSI readings.
The more recent sample favored somewhat higher thresholds.
That is exactly why we prefer robust parameter regions over one supposedly perfect setting.
Final Thoughts
The traditional RSI framework encourages traders to think in fixed numbers.
30 means oversold.
70 means overbought.
Our SPY backtest suggests reality is more nuanced.
The historical mean-reversion effect was not switched on when RSI crossed 30.
Instead, the effect generally became stronger as RSI moved deeper into oversold territory.
For the full 1993 to 2026 sample, RSI 9 produced one of the strongest combinations of profit factor, win rate, average trade, and sample size.
But RSI 14 to 16 offered a compelling compromise between trade frequency and signal quality.
And perhaps most importantly, the optimal region changed through time.
That makes the broader lesson more useful than the exact winning number:
Do not assume a popular indicator threshold is optimal just because everyone uses it. Test the entire parameter range, look for a stable region, and then check whether the result survives different exits and different market periods.
Disclaimer: Historical tendency, not a forecast. Backtested performance does not guarantee future results.
