

2 IBS Indicator Strategies That Exploit Short-Term Reversals

2 IBS Indicator Strategies That Exploit Short-Term Reversals examines how a simple but little-known indicator can help identify short-term overbought and oversold conditions.
What Is The IBS Indicator?
IBS stands for Internal Bar Strength and measures where the closing price finishes within the day’s trading range. It is calculated as:
IBS = (Close − Low) / (High − Low)
The indicator ranges from 0 to 1. A low IBS reading means the market closed near the day’s low, while a high reading means it closed near the day’s high.
IBS is often used in mean-reversion strategies. A very low reading may indicate short-term weakness and a possible rebound, while a very high reading may signal that the market is temporarily stretched. In this article, we test two IBS indicator strategies to see whether these simple signals have produced a measurable trading edge.
2 IBS Indicator Strategies That Exploit Short-Term Reversals
We backtested the two strategies (the trading rules are at the bottom of the article):
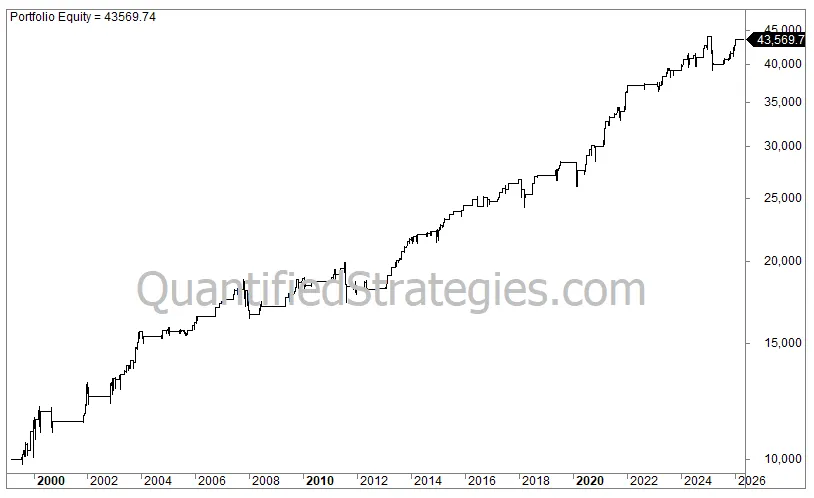
This is the first strategy (both strategies were backtested on QQQ, the ETF that tracks Nasdaq 100):
Normalized IBS Strategy
Performance
- No. of trades: 185
- Average gain per trade: 0.8%
- Win ratio: 76%
- Profit factor: 2.7
- Annual returns (CAGR): 5.6%
- Exposure/time in the market: 10%
- Risk-adjusted return: 53% (CAGR divided by time spent in the market (0.1))
- Max drawdown: 13% (buy and hold 82%)
IBS Strategy 2

Performance
- No. of trades: 439
- Average gain per trade: 0.8%
- Win ratio: 70%
- Profit factor: 2.1
- Annual returns (CAGR): 12.5%
- Exposure/time in the market: 38%
- Risk-adjusted return: 32% (CAGR divided by time spent in the market (0.38))
- Max drawdown: 45% (buy and hold 82%)
Trading Rules
Both strategies trade at the next day’s open. Below are the trading rules for the 2 strategies: