A Trend Following Strategy for Stocks (Rules, Performance)
This post looks into a recent study titled “Does Trend Following Still Work on Stocks?” by Zarattini, Pagani, and Wilcox, which extends the foundational 2005 work by Wilcox and Crittenden. We emphasize that we at QuantifiedStrategies.com have NOT backtested or verified the results.
The research provides an exhaustive look at long-only trend-following strategies, analyzing over 75 years of data from 1950 to October 2024 and simulating more than 66,000 trades across all liquid U.S. stocks.
The core conclusion is clear: trend following remains a profitable and robust strategy for stock investors, even in evolving market conditions. Crucially, the paper also introduces a significant advancement that makes this powerful strategy practical for various portfolio sizes.
Related reading:
- Weekend Trend Trader strategy (22%Annual Returns)
- Trend following strategy by industry (18% annual returns since 1926)
Trading Rules
The study utilized a comprehensive, survivorship-bias-free database of U.S. stocks.
- Entry Signal: A clear and unambiguous all-time high (ATH) breakout.
- Exit Signal: A dynamically adjusting trailing stop-loss, calculated based on 10 times the 42-day Average True Range (ATR). This allows the strategy to accommodate natural volatility and capture longer-term trends.
- Position Sizing: Determined by stock volatility to ensure each holding contributes equally to the overall portfolio’s volatility, with leverage capped at 200%.
- Index membership: The stock must be part of Russell 3000.
- Price threshold: The share price must be above 10 USD.
- Volume threshold: The 42-day average dollar volume exceeds $1 million (back-adjusted for inflation using the CPI index).
- Order execution: market-on-open orders are sent for each stock in the buy list for the next trading day.
Here is an example of a trade:

The Enduring Profitability of Trend Following
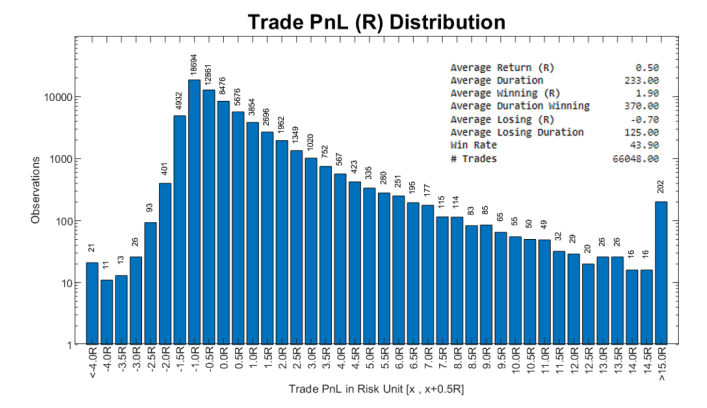
The study reaffirms that trend-following systems on U.S. equities are profitable. A conclusion from the research is the highly skewed profit distribution: less than 7% of all trades are responsible for generating the strategy’s entire cumulative profitability. This means that while many trades might yield small losses or modest gains, the overall success is driven by capturing a few significant, “outsized winners”.
The core statistics of trend following have demonstrated resilience, holding up well even in the out-of-sample period from 2005 to 2024. Despite a modest decline in average trade profitability after the original 2005 publication, the strategy maintained strong returns, partially due to an increased “opportunity set”.
Performance Characteristics
The analysis of 66,000 trades revealed several key characteristics:
- Favorable Risk-Reward: The average return per trade was 0.50R, with average winning trades returning 1.90R, significantly outweighing the average loss of -0.70R.
- Moderate Win Rate: A win rate of 43.90% is consistent with what is typically observed in trend-following, where overall profitability relies on capturing substantial price movements rather than a high percentage of winning trades. A low win rate makes it hard to trade (mentally).
- Longer Holding Periods for Winners: Winning trades, on average, lasted over one year (370 days). This extended duration is not only beneficial from a tax perspective (avoiding short-term capital gains) but also highlights a clear positive correlation between trade duration and PnLR (profit and loss ratio) – longer-held trades tend to produce higher returns. This underscores the importance of patience in capturing large market moves.

Theoretical Performance: Impressive Returns Before Costs
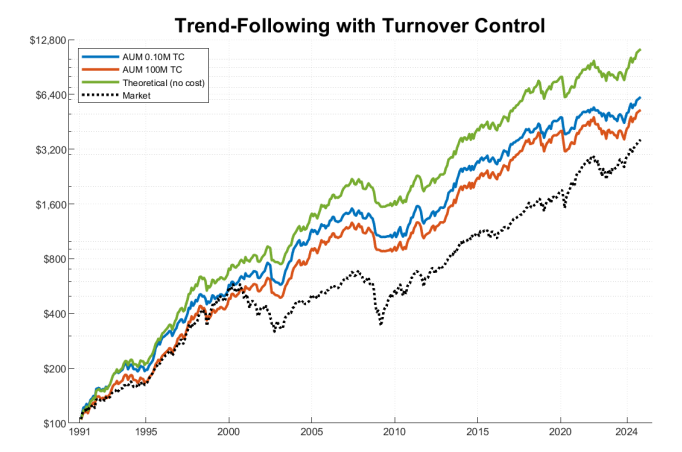
Before accounting for real-world trading frictions, a theoretical long-only trend-following portfolio from 1991 to 2024 demonstrated exceptional performance:
- Compound Annual Growth Rate (CAGR): Approximately 15.02%, significantly outpacing the market index’s 11.18% CAGR.
- Enhanced Risk-Adjusted Returns: A Sharpe ratio of 0.85, comfortably surpassing the broad market’s 0.54.
- Reduced Drawdowns: A maximum drawdown contained at 32%, compared to nearly 55% for the market during the Great Financial Crisis.
- Statistically Significant Alpha: An annualized alpha of 6.19%, confirming its capacity to deliver outperformance.

The results broken down to months and years:

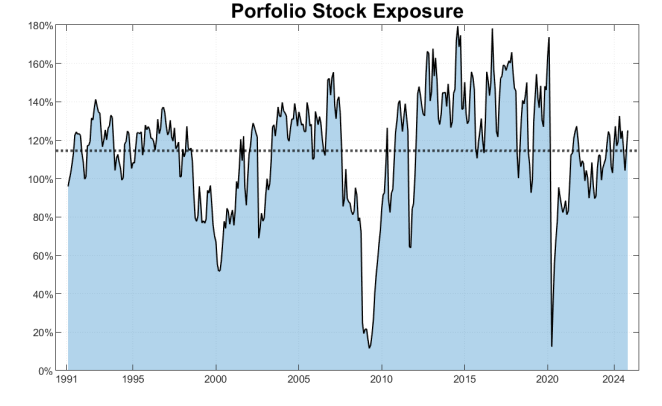
Market exposure varies, as expected:
The Real-World Challenge: High Turnover & Transaction Costs
Despite the strong theoretical results, the study identified a significant hurdle for practical implementation: high daily turnover.
The continuous rebalancing and numerous small adjustments inherent in the baseline model lead to substantial transaction costs, including commissions, slippage, and borrowing expenses.
These costs can severely dampen performance, especially for portfolios with Assets Under Management (AUM) less than $1 million. For instance, a $100,000 portfolio saw its CAGR drop dramatically from 15.02% to just 2.45% once these real-world costs were factored in.
The Solution: Introducing the Turnover Control Mechanism
To overcome the crippling impact of transaction costs and enhance the strategy’s practical viability, the researchers developed and integrated a sophisticated Turnover Control mechanism. This mechanism significantly mitigates cost burdens by:
- Skipping minor rebalancing adjustments that might otherwise incur disproportionate fees.
- Distributing larger trades over multiple days to minimize market impact and slippage.
- Avoiding rebalances when the expected commission costs would exceed a preset threshold relative to the notional amount traded.
Enhanced Real-World Viability: Trend Following for All AUM Levels
The implementation of the Turnover Control mechanism dramatically improved the net-of-fee performance, making the strategy attractive across all tested portfolio sizes. For example, the yearly performance drag due to commissions for a $100,000 portfolio decreased from over 10% to less than 1%. For larger portfolios, slippage was also significantly reduced (from 3% to 1.3% for a $100M AUM).
The revised performance statistics show that even a $100,000 AUM portfolio, after costs and with turnover control, achieved a CAGR of 12.97% and an annualized alpha of 4.94%. This demonstrates the mechanism’s success in narrowing the gap between theoretical and tradable performance, ensuring the strategy’s viability for a broad range of investors.
Conclusion: The Sustained Potential of Systematic Trend Following
This research robustly demonstrates the sustained potential of long-only trend-following strategies when applied systematically to individual U.S. stocks.
While high turnover and transaction costs present significant practical challenges, the introduction of the innovative Turnover Control mechanism transforms the strategy, making it not only theoretically sound but also practically viable and highly attractive for investors of various capitalizations seeking to capture significant outlier returns in individual stocks.
The findings reinforce the value of disciplined risk management and advanced portfolio techniques in achieving consistent outperformance.