
A Simple Trading Rule Every Trader Should Know

Imagine making $100 million in a single day.
That is reportedly what Paul Tudor Jones did during the 1987 stock market crash. But the most interesting part is not only how much he made. It is how simple the underlying idea was.
He used the 200-day moving average.
The rule is straightforward:
When the price is above the 200-day moving average, stay invested.
When the price is below the 200-day moving average, get out.
In other words:
Price above the 200-day moving average = buy or stay long.
Price below the 200-day moving average = sell or stay out.
This simple rule can help traders avoid some of the worst market crashes and protect capital when trends turn negative. For example, a 200-day moving average filter would have kept traders out of much of the dot-com crash and the 2008 financial crisis.
Below is the S&P 500 during the so-called “lost decade”:
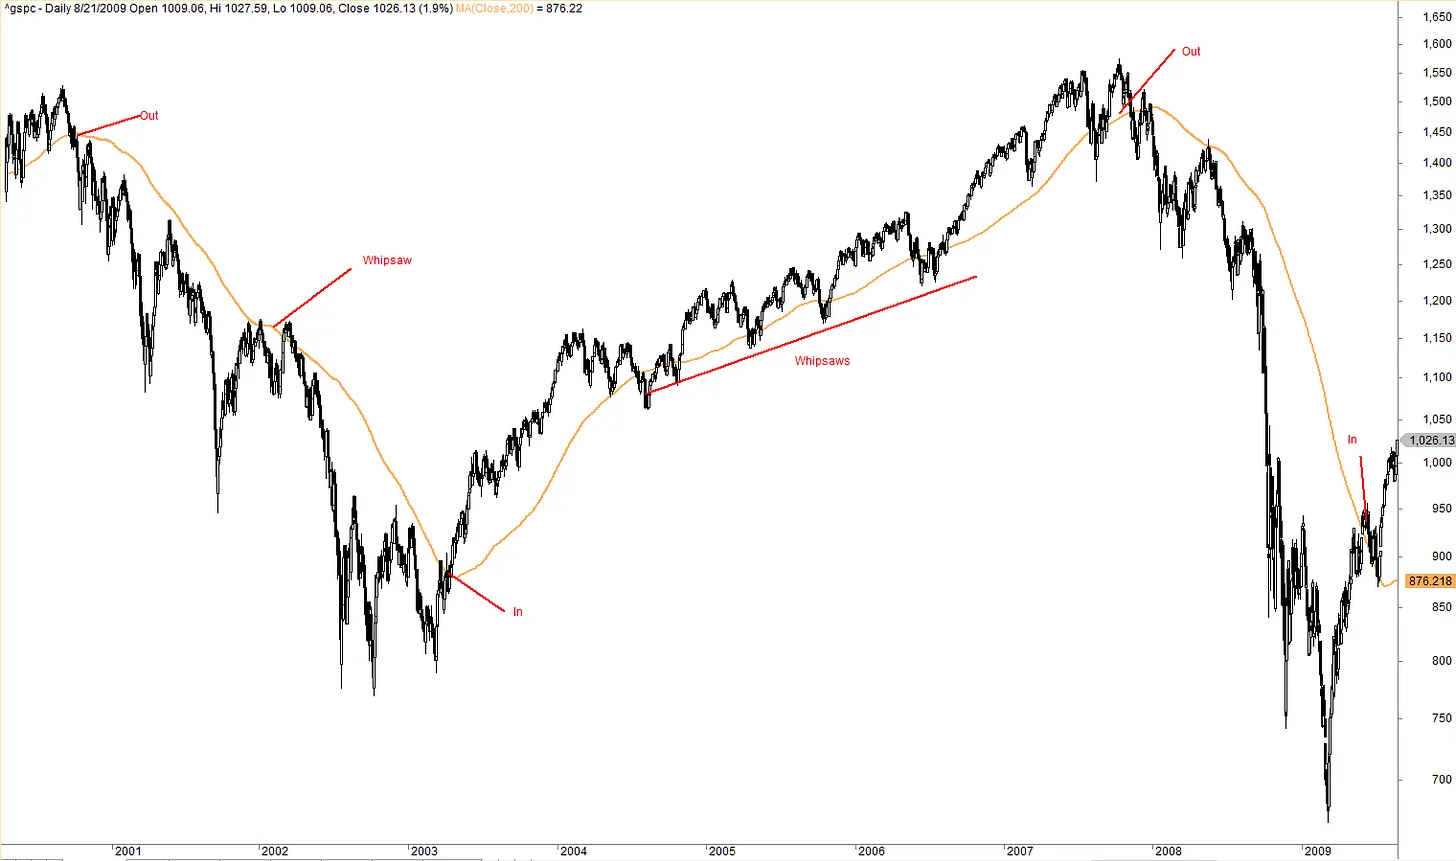
The 200-Day Moving Average Can Save You
Since 1960, the 200-day moving average strategy has produced returns similar to buy and hold, but with much smaller drawdowns.
That is the key benefit.
The rule is not necessarily about maximizing every bit of upside. It is about reducing exposure when the market enters a major downtrend.
[Chart]
The 200-Day Moving Average And The S&P 500
But does this rule only work on stocks?
Not necessarily.
To see why, let’s look at the MLM Index.
What Is The MLM Index?
The MLM Index, created by Mt. Lucas Management, is based on one simple trend-following indicator: the 200-day moving average.
The index applies a moving-average crossover system across 25 equally weighted futures markets.
The rule is simple:
If the price at the end of the month is above its 200-day moving average, the index holds a long position for the next month.
If the price is below its 200-day moving average, the index holds a short position for the next month.
Can it get much simpler?
The MLM Index includes 25 futures contracts across seven major categories:
Grains: corn, soybeans, soybean meal, soybean oil, and wheat.
Livestock: live cattle.
Energy: heating oil, crude oil, natural gas, and unleaded gasoline.
Metals: gold, silver, and copper.
Food and fiber: coffee, cotton, and sugar.
Financials: 5-year Treasury notes, 10-year Treasury notes, and Treasury bonds.
Currencies: Australian dollar, British pound, Canadian dollar, German mark, Swiss franc, and Japanese yen.
Notice that no stock market indices are included in the MLM Index.
How Has This Simple Method Performed?
The MLM Index has data going back to the 1960s. In his book Evidence-Based Technical Analysis, David Aronson included charts showing the performance of the index up until 2005.
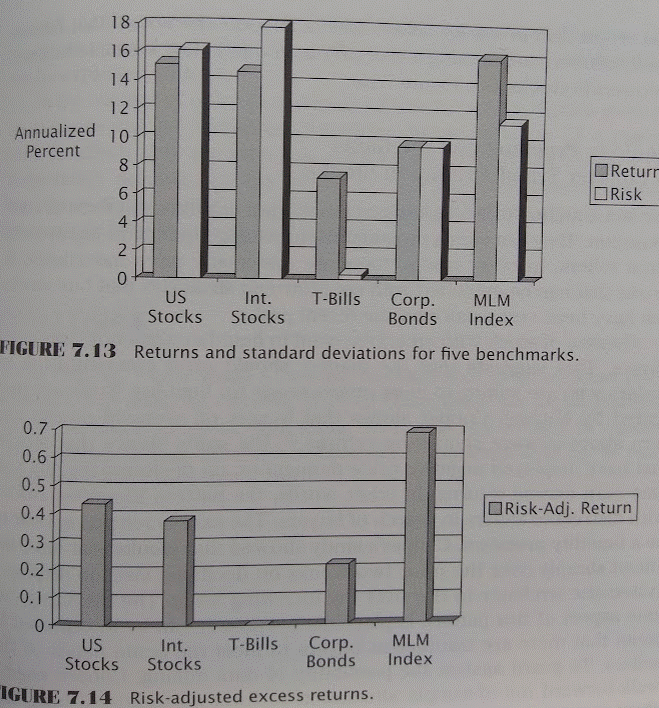
The results are interesting.
The annual returns have been roughly in line with stocks, but with lower risk. The second chart also shows that the MLM Index has performed better than stocks on a risk-adjusted basis.
Even better, the MLM Index has historically had only a weak correlation with stocks.
That makes it useful from a diversification perspective.
Why This Matters
The 200-day moving average is not a magic formula. It does not work all the time, and it will sometimes produce false signals.
But it has one major advantage: it keeps you disciplined.
Instead of guessing, predicting, or reacting emotionally, you follow a clear rule.
When the market is above the long-term trend, you participate.
When the market falls below the long-term trend, you reduce risk.
That simplicity is exactly why the 200-day moving average has survived for decades.
Sometimes, a simple rule is all you need to stay on the right side of the trend.