Can You Time the Market with Quarterly Patterns?
Timing the stock market is a dream for many investors, but is it possible? By analyzing historical data, we looked at quarterly performance patterns in the SPY (SPDR S&P 500 ETF Trust) that suggest some quarters may offer better opportunities than others.
Our backtest from 1960 to today reveals that the first and fourth quarters consistently outperform, while the third quarter lags behind. Could these patterns help you time the market? Let’s dive into the data and explore what it means for your portfolio.
Why Quarterly Patterns Matter in Stock Market Investing
The stock market is influenced by countless factors—economic cycles, corporate earnings, geopolitical events, and investor sentiment.
Yet, amidst this complexity, seasonal patterns can emerge. Quarterly performance trends, in particular, offer a lens to evaluate whether certain times of the year are more favorable for investing.
Our analysis focuses on the SPY, a popular ETF tracking the S&P 500, which represents 500 of the largest U.S. companies. By examining average quarterly returns from 1960 to today, we identified distinct patterns.
The Data: SPY’s Quarterly Performance (1960–2025)
We backtested the SPY’s performance across four quarters, calculating the average percentage return per quarter from 1960 to today. Here’s what we found:
- Q1 (January–March): +2.2%
- Q2 (April–June): +1.7%
- Q3 (July–September): +0.4%
- Q4 (October–December): +4.1%
These figures reveal a clear hierarchy: Q4 is the strongest quarter, delivering an average return of 4.1%, followed by Q1 at 2.2%. Q2 performs respectably at 1.7%, while Q3 is the weakest, averaging just 0.4%.
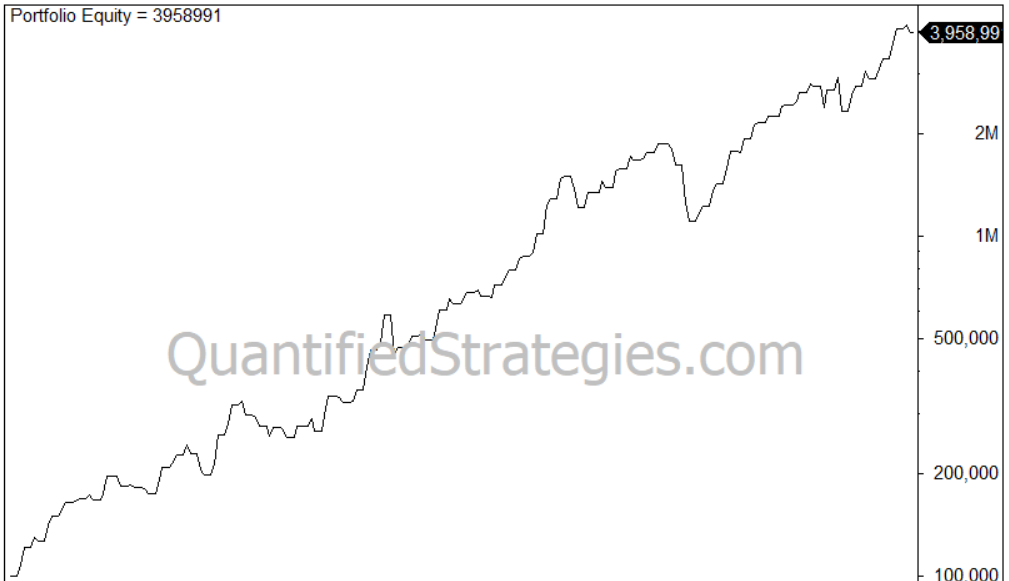
If you were invested only during the 4th and 1st quarter from 1960 until today, the equity curve would look like this:
The Case for Timing the Market
The data suggests that the first and fourth quarters are the most lucrative for SPY investors, while the third quarter underperforms significantly. This raises an intriguing question: could you improve returns by overweighting your portfolio in Q1 and Q4 and reducing exposure in Q3?
For example, an investor who allocates more capital to SPY during Q4 (October–December) could capitalize on its historical 4.1% average return. Conversely, minimizing exposure in Q3 (July–September) might help avoid the weakest period, where returns average just 0.4%.
This strategy aligns with well-known market adages like “Sell in May and go away,” which implies weaker performance in the summer months (part of Q2 and Q3). However, our data suggests that Q3 is the true laggard, making it a prime candidate for reduced investment.
Why Does Q3 Underperform?
Several factors may contribute to Q3’s lackluster performance (but this is mostly guessing):
- Seasonal Slowdowns: Summer months often see reduced trading volumes as investors take vacations, leading to lower market momentum.
- Earnings Season Dynamics: Q3 includes July earnings reports, which can introduce volatility if companies miss expectations.
- Historical Trends: Events like the September market corrections (e.g., the 2008 financial crisis) may skew Q3 returns downward.
While these factors don’t guarantee poor Q3 performance every year, the historical average suggests caution during this period.
Risks of Market Timing
While the quarterly patterns are compelling, market timing is not without risks. Here are some considerations:
- Yearly Variations: Not every Q3 is weak, and not every Q4 is strong. Outlier years can disrupt patterns.
- Transaction Costs: Frequent buying and selling to time quarters can rack up fees, eating into returns (not to mention taxes).
- Market Unpredictability: Unexpected events (e.g., geopolitical crises or Federal Reserve actions) can override seasonal trends.
- Opportunity Costs: Sitting out Q3 entirely might mean missing unexpected rallies.
How to Use Quarterly Patterns in Your Strategy
If you’re intrigued by these findings, here are ways to incorporate quarterly patterns into your investment approach:
- Rebalance Seasonally: Increase your SPY allocation in Q1 and Q4, and scale back in Q3.
- Use Dollar-Cost Averaging: Invest a fixed amount monthly but adjust contributions slightly to favor stronger quarters.
- Combine with Other Indicators: Pair quarterly trends with technical analysis (e.g., moving averages) or macroeconomic signals to confirm entry and exit points.
- Stay Disciplined: Avoid overreacting to short-term noise. Stick to a long-term plan.
Frequently Asked Questions (FAQ)
Is the Fourth quarter the strongest quarter?
Yes, the fourth quarter is the strongest quarter in the stock market. While Q4 has historically delivered the highest average return (4.1%), past performance doesn’t guarantee future results.
Should I Avoid Investing in Q3?
Q3’s 0.4% average return suggests caution, but completely avoiding it may not be wise. Consider reducing exposure rather than exiting entirely.
How Reliable Are Quarterly Market Patterns?
Our 65-year backtest provides robust evidence, but markets are dynamic. Use quarterly patterns as one tool among many in your investment toolkit.
Conclusion: Can You Time the Market?
Our backtest of SPY from 1960 to 2025 reveals that Q1 and Q4 are the strongest quarters, averaging 2.2% and 4.1% returns, respectively, while Q3 lags at 0.4%.
These patterns suggest that tilting your portfolio toward stronger quarters and reducing exposure in Q3 could enhance returns. However, market timing carries risks, and no strategy is foolproof.
By combining quarterly trends with disciplined investing, you can make smarter decisions without chasing elusive market perfection. Ready to refine your strategy? Start by analyzing your portfolio and exploring how seasonal patterns fit into your goals.