Is This A Tradeable Crypto Seasonality Trading Strategy?
The end of month/early month strategy is well-documented in the stock market. This is called the turn-of-the-month strategy.
This effect exists in most “risky” assets. Also in crypto. Let’s backtest the following trading rules:
Trading Rules
- Buy the 5th last trading day of the month, and
- Sell on the 3rd trading day of the new month.
Amibroker code
Buy= Ref(Month(),4)!=Ref(Month(),5) and c>ref(c,-22) ;
buyPrice=Close;
Sell= Ref(Month(),-3)!=Ref(Month(),-2);
sellPrice=Close ;
[/am4show]
Key Takeaways
- Bitcoin turn-of-month effect shows seasonal pattern
- Crypto seasonality strategies exploit monthly momentum
- Buying before month-end captures bullish flows
- Trend filter improves Bitcoin strategy performance
- Backtests show higher win rate with trend filter
- Seasonality strategies require strict risk management
- Crypto markets trade 24/7 affecting monthly cycles
- Backtesting essential before live crypto trading
This has returned the following equity curve for Bitcoin:
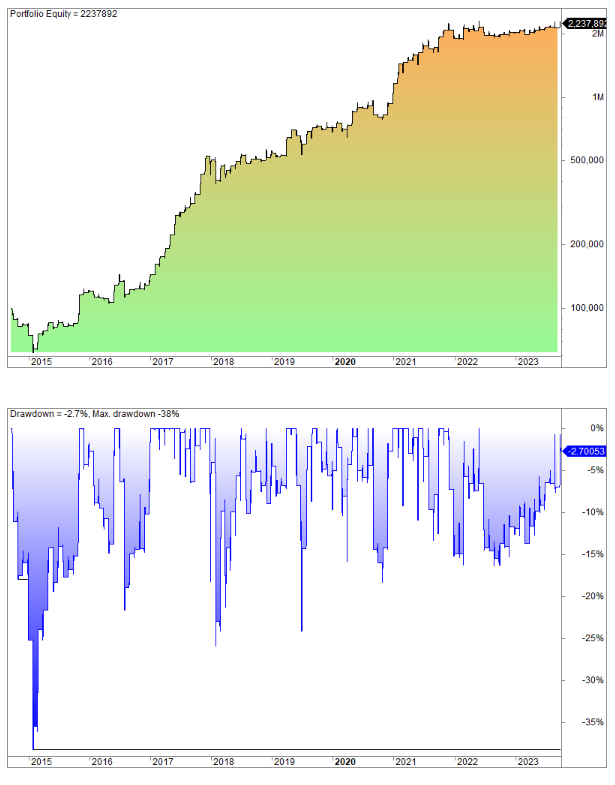
The 109 trades have returned 3.3% on average and the win rate is 67%. Remarkably, the max drawdown is pretty low at 38%, and only 25% since 2015.
If we use a trend filter* (the close must be higher than 22 days ago), that we know has worked well in the past the result improves:
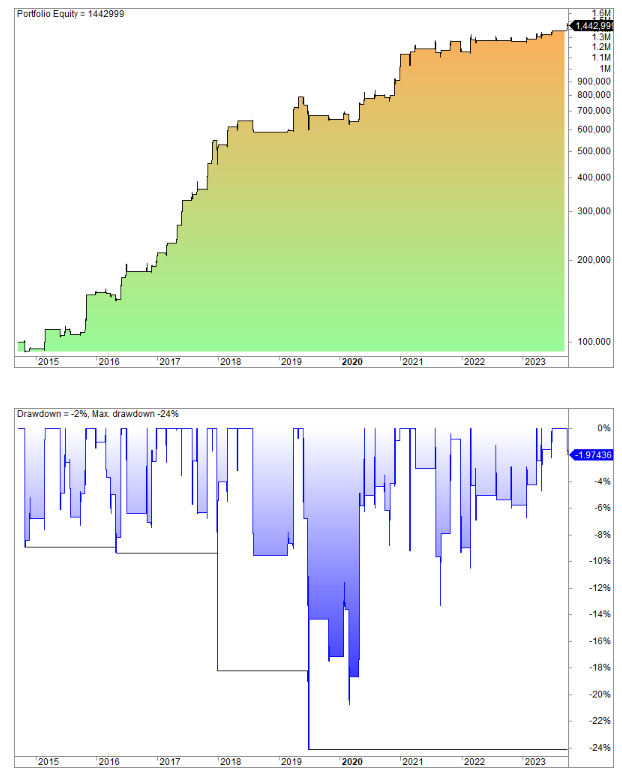
The number of trades drops to only 58, but the average goes up to 5.1% per trade.
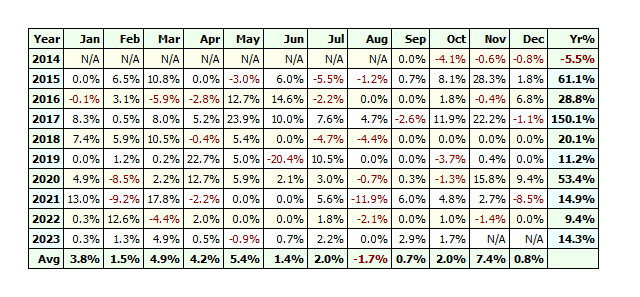
Only 2015 is a losing year:
*We have used this trend filter in previous BTC articles. Bitcoin trades 24/7, however, so it’s not one month, like the stock market.
Disclaimer
Quantified Strategies (SIA Lofjord) is not an investment advisor. The content and information provided are educational and should not be treated as financial advisory services or investment advice. Trading and investment in securities involve substantial risk of loss and is not recommended for anyone that is not a trained trader or investor – it shall be conducted at your own risk. It is recommended that you never risk more than you are willing to lose. Leverage can lead to substantial losses. Any use of leverage, margin, or shorting is at your discretion. Quantified Strategies (SIA Lofjord) is not responsible for any losses that occur as a result of its content and information. Always use a demo account for many months before you do live trading. Trading requires hard and systematic work – there is no easy money, and markets change all the time. And remember: always trade smaller position sizes than you’d like to.
Hypothetical or simulated performance results have certain limitations. Unlike an actual performance record, simulated results do not represent actual trading. Commissions and slippage are not included, and most trading signals are triggered at the close. Also, since the trades have not been executed, the results may have under or overcompensated for the impact, if any, of certain market factors, such as lack of liquidity. Simulated trading programs, in general, are also subject to the fact that they are designed with the benefit of hindsight. No representations are made that any account will or is likely to achieve profit or losses similar to those shown.