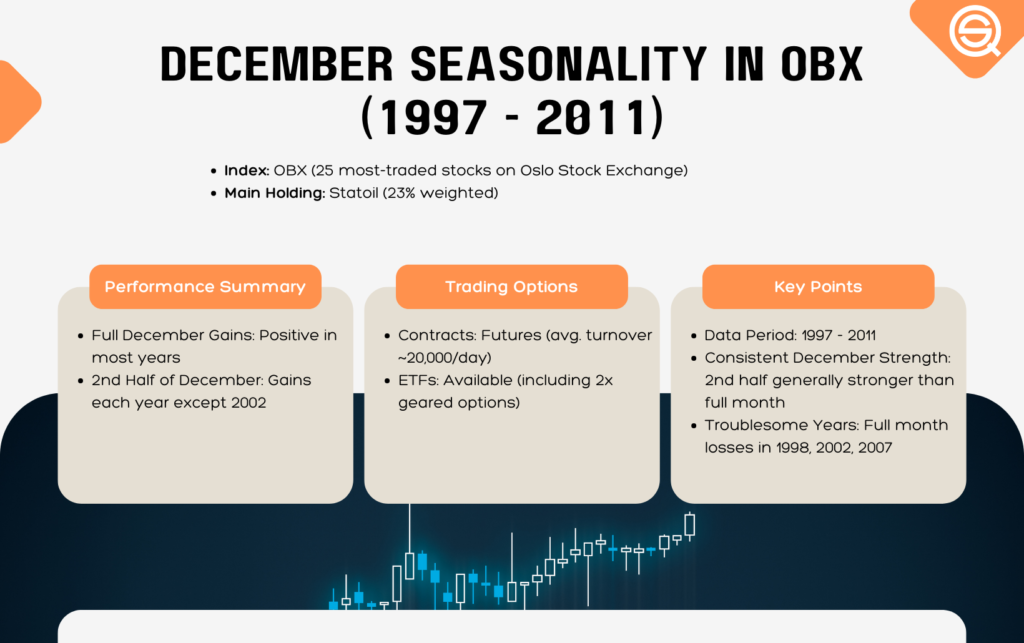
December Seasonality In OBX Key Insights (Oslo Stock Exchange)
Below you can find the gain each year from 1997 until 2011 in OBX. It’s divided into two: The whole of December and the 2nd half of December. The 2nd half is from the close of the 15th or the day before if the 15th was on a weekend.
OBX consists of the 25 most traded securities on Oslo Stock Exchange. It’s rebalanced twice a year. You can either buy/sell OBX as a futures contract (average turnover about 20 000 contracts a day), or you can buy an ETF which are fairly liquid (there are a couple of them, even with 2x gearing). Or you can try spread betting.
Worth mentioning is that Statoil, the former state oil company (they still own the majority), is weighted about 23% of the index.
Here are the results:
As you can see, only 1998 2002 and 2007 were troublesome for the whole of December. The second half of December is only down in 2002.
FAQ:
– What time frame does the provided data cover, and what specifically does it show?
The data covers the period from 1997 to 2011. It demonstrates the gains in the OBX for each year, particularly focusing on December. The December gains are further divided into the whole month and the second half of December.
– How can investors participate in the OBX?
Investors can participate in the OBX by trading futures contracts, ETFs, or spread betting. OBX futures contracts have a daily average turnover of about 20,000 contracts. Several ETFs, some with 2x gearing, are also available for trading.
– What does the data reveal about the performance of the OBX during December for the years 1997 to 2011?
The data shows that, in general, December has been a positive month for the OBX, with gains seen in most years. There were only a few troublesome years, such as 1998, 2002, and 2007, while the second half of December experienced a decline in 2002.


