Historical Drawdowns and Recoveries: What the Data Reveals (Statistics And Facts)
Investing and trading for the long term, even in the most promising assets, invariably involves enduring periods of significant price declines, known as drawdowns. A drawdown is defined as the price decrease from a peak to a trough.
As Charlie Munger, former vice chairman at Berkshire Hathaway, famously remarked, if you are unwilling to “react with equanimity to a market price decline of 50 percent 2 or 3 times a century, you’re not fit to be a common shareholder”. This perspective underscores a fundamental truth: significant drawdowns are often an unavoidable cost for achieving superior long-term investment returns. This applies to both trading and investing. Unfortunately, most investors fold at much smaller drawdowns than 50%.
This article is based on findings from Michael Mauboussin’s analysis of historical drawdowns for both stocks and mutual funds. He points out that painful drawdowns exist even in a world with perfect foresight into long-term returns, and then offers some qualitative guidelines for considering which stocks may bounce off the bottom.
The Stark Reality of Drawdowns
The journey to wealth creation in public markets is heavily skewed, with a small fraction of companies responsible for the vast majority of aggregate wealth creation. For instance, a study of nearly 28,600 public companies listed in the U.S. from 1926 to 2024 revealed that just about 2% of these companies generated 90% of the total $79.4 trillion in wealth creation. For more facts about this, please read Do Stocks Outperform Treasury Bills.
Even these “super wealth creators” are not immune to sharp declines. Amazon, which created $2.1 trillion in wealth from its 1997 IPO to 2024, saw its shares plummet 95% from December 1999 to October 2001. Or what about this:
The top 6 wealth-creating companies experienced an average maximum drawdown of 80.3%!
It’s crucial to remember that studies like this are based on hindsight, meaning we know the outcomes after they’ve occurred. When an investor is in the midst of a stock decline, there is no way to know where the bottom is or which stocks will ultimately rebound and become “great stocks”. Nevertheless, studying past drawdowns provides valuable context for understanding equity markets and individual stock returns.
Statistical Insights into Drawdowns and Recoveries
Maubossin’s analysis of over 6,500 U.S. stocks from 1985 to 2024 reveals compelling base rates for drawdowns and recoveries. The median maximum drawdown was 85%, taking 2.5 years from peak to trough. More than half (about 54%) of stocks never return to their prior peak price (par) after hitting bottom. For those that do recover, the median time to return to par was also 2.5 years.
However, the averages paint a different picture due to the skewness in the data. The average drawdown was 80.7% over 3.9 years, but the average recovery was a remarkable 338.5% of par, indicating that some stocks generated exceptionally high returns from their lows.
The frequency of stock peaks (marking the beginning of drawdowns) often coincides with broader stock market peaks, such as the dot-com boom (2000), the period before the global financial crisis (2007-2008), and the COVID bounce-back (2021).
Similarly, the ending dates of maximum drawdowns (troughs) align with periods of poor market returns, including the dot-com bust (2003), the global financial crisis (2009), and the COVID market shock (2020).
The magnitude of a drawdown significantly impacts its duration and recovery prospects:
• Larger drawdowns take longer to occur: Stocks with 95-100% drawdowns took an average of 6.7 years to reach their trough, compared to just 1 year for 0-50% drawdowns.
• Lower probability of returning to par: Only about one in six stocks that decline 95-100% ever return to their prior peak, whereas four in five stocks in the 0-50% drawdown group do.
• Spectacular percentage bounces from the bottom: While fewer stocks with large drawdowns return to par, their percentage recoveries from the absolute low can be immense. For example, a stock dropping 97.5% from $100 to $2.50, and then recovering to 16% of par ($16), represents a 6.4x return from the bottom.
• Higher subsequent returns (median CAGR): Generally, the larger the percentage drop in a stock, the greater the median annualized total shareholder returns (TSR) in the years following its nadir. For the largest drawdown bin (95-100%), the median CAGR in TSR for the next 5 and 10 years was 54.9% and 32.6% respectively, significantly higher than the 23.3% and 19.0% for the smallest bin (0-50%).
Exhibit 1: Maximum Drawdowns and Recoveries for U.S. Stocks, 1985-2024
| Statistic | Max Drawdown | Max Drawdown Duration (Years) | Peak Recovery from Max Drawdown (% of Par) | Time Back to Par (Years) |
|---|---|---|---|---|
| Median | -85.4% | 2.5 | 89.6% | 2.5 |
| Average | -80.7% | 3.9 | 338.5% | — |
Exhibit 2: Base Rates for Drawdown Duration and Recoveries By Max Drawdown, 1985-2024
| Max Drawdown | Max Drawdown Duration, Avg (Years) | Peak Recovery as % of Par (Median) | % That Get Back to Par | Time Back to Par, Avg (Years) | Count |
| 95–100% | 6.7 | 16.00% | 16.00% | 8 | 1842 |
| 90–95% | 4.3 | 65.00% | 37.00% | 5.8 | 830 |
| 85–90% | 3.7 | 78.00% | 42.00% | 4.6 | 678 |
| 80–85% | 3.2 | 100.00% | 49.00% | 4.2 | 584 |
| 75–80% | 3.1 | 122.00% | 54.00% | 3.8 | 501 |
| 70–75% | 2.5 | 131.00% | 62.00% | 3.4 | 456 |
| 65–70% | 2.3 | 134.00% | 67.00% | 3.2 | 394 |
| 60–65% | 1.9 | 149.00% | 67.00% | 2.5 | 325 |
| 55–60% | 1.7 | 147.00% | 74.00% | 2.2 | 276 |
| 50–55% | 1.4 | 150.00% | 77.00% | 2 | 241 |
| 0–50% | 1 | 146.00% | — | — | — |
The Compounding Challenge and Visualizing Patterns
While large percentage bounces from the bottom are possible, the “math of compounding” means that a substantial recovery from a deep decline might still leave the stock well below its original peak. For example, a $100 stock dropping 50% for five years to $3.13, then rising 50% for five years, only reaches $23.73 – still far from $100.
Visualizing these patterns, Exhibit 3 shows that stocks with the largest maximum drawdowns often follow a pronounced “V” pattern, with a sharp decline followed by a strong price recovery.
However, the portfolio value of these stocks typically fails to reach the peak established two years before the bottom; five years after the trough, it might only be 80% of its value two years prior. In contrast, stocks with the smallest maximum drawdowns, while less dramatic in their fall and rise, fully recover and achieve solid gains following their lows. When adjusted for risk (abnormal returns), the recovery for the largest drawdown quintile is much more muted, reaching only 40% of its pre-drawdown value five years after the trough.
Exhibit 3: Returns of Stocks with Largest and Smallest Max Drawdowns, 1985-2024
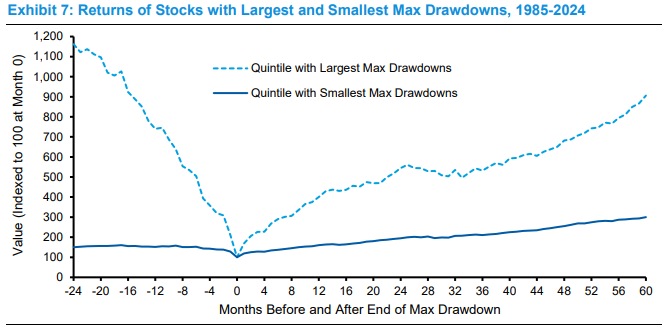
The largest drawdown quintile starts significantly higher and ends lower than its initial point, while the smallest drawdown quintile starts lower and ends significantly higher.)
Even Perfect Portfolios Suffer
The concept that “Even God Would Get Fired as an Active Investor” highlights that even a portfolio constructed with perfect foresight to achieve the highest returns would still experience “gut-wrenching drawdowns”.
A perfect-foresight portfolio of the top 50 S&P 500 stocks from 1927 to 2016 produced annualized returns three times higher than the S&P 500, yet it suffered a worst drawdown of 76% (during the Great Depression) and five drawdowns of 30% or more. This illustrates the profound difficulty active managers face in navigating market fluctuations, even with ideal stock selections.
Diversification offers a degree of protection. While individual stocks experience much larger drawdowns, the S&P 500 index had a maximum drawdown of 58%, a duration of 1.4 years, and recovered to par in 4.2 years.
Mutual funds, being more diversified than individual stocks but less so than broad indexes, also show smaller drawdowns than individual stocks, but larger than the S&P 500. The median drawdown for the top 20 U.S. equity mutual funds from 2000-2024 was 59%, recovering to par in a median of 1.9 years and subsequently generating strong risk-adjusted returns (alpha).
The Tale of Two Recoveries: NVIDIA vs. Foot Locker
Case studies of NVIDIA and Foot Locker dramatically illustrate the different paths following significant drawdowns.
• NVIDIA Corporation, a leader in GPUs and AI, experienced a 90% drawdown from January to October 2002. This rapid decline occurred during the dot-com bust, affecting the broader semiconductor industry. Despite this severe drop, NVIDIA’s stock recovered its prior peak in 4.1 years and went on to be the best-performing S&P 500 stock for the 20 years ending in 2024. NVIDIA’s recovery was part of a cyclical industry rebound.
• Foot Locker, Inc. (formerly F.W. Woolworth), suffered a 91% maximum drawdown from July 1990 to February 1999, a protracted decline lasting 8.6 years. Unlike NVIDIA, Foot Locker’s stock took a much longer 13.6 years to return to par, reaching that point only in September 2012. In May 2025, Foot Locker was acquired at 30% of its all-time peak price from December 2016. Foot Locker’s long decline reflected a secular decline in Woolworth’s core retail business, even as the broader retail sector grew.
The contrast highlights that while the magnitude of drawdown can be similar, the circumstances (cyclical vs. secular issues) and subsequent recovery paths can be vastly different.
What Academic Research Tells Us
Academic research on stock market drawdowns is diverse, but some consistent patterns emerge. The “overreaction hypothesis” suggests that investors tend to overreact to both good and bad news, causing stock prices to overshoot or undershoot their intrinsic values.
Studies have shown that portfolios of “loser” stocks (those with poor recent returns) tend to outperform “winner” portfolios (those with good recent returns) in subsequent periods. However, this outperformance is often driven by a few extreme outliers, meaning the median “loser” stock still performs poorly.
Research also indicates that retail investors are more likely to buy more shares of a stock after it has declined (known as “averaging down”). The psychological motivation is to lower their average cost and mitigate loss aversion.
However, this strategy has not empirically benefited the returns of investors who employed it. While some renowned investors like Bill Miller advocate for “averaging down” as a strategy when a stock drops, if one believes in its underlying value, others like Paul Tudor Jones advise against it, emphasizing that “Losers Average Losers”.
Qualitative Guidelines
While “trying to pick a bottom is a fool’s errand”, certain qualitative considerations can help identify stocks with the potential for a rebound after a large price decline:
• Are the Fundamental Issues Cyclical or Secular? Cyclical downturns (like in the semiconductor industry) often see demand rebound, while secular declines (like traditional retail formats falling out of favor) suggest no inherent reason for demand to return. Fundamental turnarounds are challenging and rare.
• What Does the Basic Unit of Analysis Tell You About the Business? A company’s stock can recover if its core economic proposition creates value. Recovery is unlikely if the underlying business model is flawed or struggles with economies of scale.
• How Lumpy Are the Investments in the Business? Businesses requiring large, “lumpy” investments (e.g., a $20 billion semiconductor fab) face greater risk if they struggle before generating sales and profits, as scaling down such investments is difficult. Businesses with smaller, more incremental investments (e.g., a $1.5-3 million Shake Shack store) can more easily adjust.
• Is There Sufficient Financial Strength and Access to Capital? A company needs adequate financial strength to weather a downturn and must have access to capital markets if needed, especially since a lack of liquidity can threaten even a solvent company.
• Is Management Clear-Eyed about the Challenges? A crucial step toward recovery is a management team that clearly understands the challenges and is willing to take decisive action to preserve and enhance the business’s value.
Conclusion
Drawdowns are an integral part of long-term investing, even for the most successful investments. While individual stocks and mutual funds inevitably face them, the path to recovery varies significantly based on factors like the cause of the decline and the company’s underlying fundamentals.
Understanding these patterns and exercising temperament during market volatility are key for investors seeking superior long-term returns. Instead of attempting to time the market’s bottom, investors should focus on identifying businesses with strong, viable economic propositions and clear-sighted management, which are better positioned for recovery.