
Golden Cross Trading Strategy
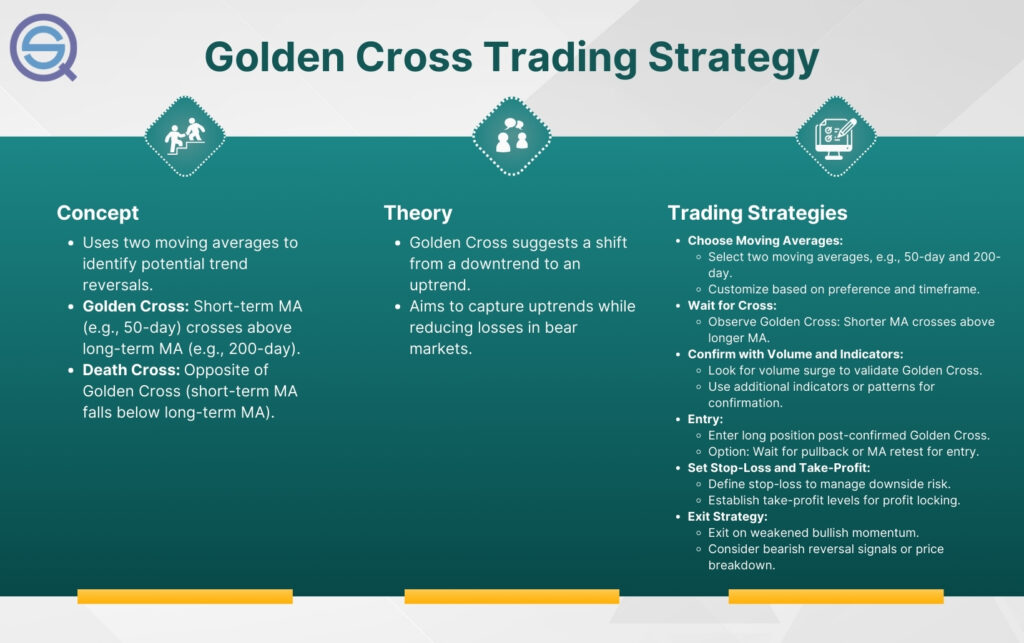
Golden Cross Trading Strategy is famous and a cited phenomenon in the media. In this article, we look at the performance of the Golden Cross in the S&P 500. A Golden Cross involves two moving averages – one short and one long. Typically, the strategy uses a short term average, such as the 50-day moving average, and a long term average, like the 200-day moving average, to compare recent and historical average prices.
A Golden Cross is considered a bullish pattern that signals a potential upward trend when the short term average crosses above the long term average. This crossover indicates that the recent average price is exceeding the historical average, reflecting a shift in market momentum and sentiment. The pattern is observed across different asset classes, but its effectiveness can vary depending on the asset class due to differences in volatility and market structure. The golden cross is a lagging indicator, confirming a trend only after the asset’s price has already moved.
You will also find a Golden Cross Trading Strategy Glossary if you want to learn more about this indicator. Understanding the broader market context and using other indicators alongside the golden cross can help filter out false signals and improve trading outcomes.
Key Takeaway
The Golden Cross is one of the most recognized bullish signals in technical analysis. It occurs when a short-term moving average crosses above a long-term moving average, signaling a major shift in upward momentum.
- The Setup: Most commonly tracked as the 50-day SMA crossing above the 200-day SMA.
- The Signal: Indicates a transition from a bearish/stagnant market to a bullish trend.
- Performance (S&P 500): Backtesting since 1960 shows a 79% win rate with significantly lower drawdowns (33%) compared to Buy-and-Hold (56%).
- Risk-Adjusted Return: While it slightly trails buy-and-hold in raw returns, its 9.6% risk-adjusted return outperforms the market by staying invested only 70% of the time.
- The Verdict: It is a lagging indicator best used for “playing defense” – keeping you invested during bull runs and moving you to cash before the worst of a bear market hits.
Let’s start by explaining in more detail what the Golden Cross in trading is:
What is the Golden Cross Trading Strategy?
Golden Cross explained
A Golden Cross involves two moving averages – one short and one long. When the short-term moving average crosses above the long-term moving average, we have a Golden Cross.
We like to use the 50-day and the 200-day averages. Thus, when the 50-day moving average breaks above the 200-day moving average a Golden Cross is formed.
A golden cross forms through three stages: first, an initial downtrend or consolidation phase; second, the crossover occurs when the short-term moving average crosses above the long-term moving average (the second stage); and third, confirmation of a bullish signal with positive momentum and increased buying volume. This bullish breakout pattern often leads to an upward trend and potentially higher prices as market sentiment shifts.
However, traders should be cautious not to enter trades immediately after a golden cross occurs without waiting for confirmation from other indicators.
For some reason, this breakout attracts a lot of media attention and a lot of speculation about a potential bull market. Is this for a good reason? You’ll find out after our backtests further below.
Why should the Golden Cross Trading Strategy work?
The stock market tends to be in a long-term uptrend due to inflation and productivity gains, and the Golden Cross Trading Strategy aims to exploit this upward bias while reducing losses in bear markets.
The golden cross trading strategy tends to perform best in trending markets, where strong upward or downward trends are present. In contrast, range bound markets, where prices move sideways within a defined range, can produce numerous false signals, making the strategy less reliable in such conditions. Combining fundamental factors and fundamental indicators with technical analysis can further improve the reliability of the golden cross signal by confirming market sentiment and potential trend reversals.
In fact, the Golden Cross can help you stay out of a significant bear market, and while the strategy is prone to whipsaw signals, the few big winners can make up for it.
Traders should always apply robust risk-management techniques, including well-defined stop-loss orders, to guard against unexpected market movements.
So, how do you use the Golden Cross indicator?
Golden Cross and time frame
When backtesting the Golden Cross Trading Strategy, which time frame are we looking at? In this article, we use daily bars. But you can, of course, use any time frame you want. Traders can select different specified periods for the moving averages, such as 20, 50, or 100 days, depending on their trading style and market conditions. There is no right or wrong in trading as long as it works.
Shorter moving average crosses, such as when a 20-day crosses above a 50-day, can generate more frequent signals. This approach is often favored by short-term traders and those engaged in swing trading, as it can provide earlier entry and exit points for momentum shifts and trend identification over a few days to weeks. However, using shorter periods may also increase the risk of false signals, especially in volatile markets.
Death Cross
The death cross is a well-known technical chart pattern that serves as the bearish counterpart to the golden cross. This pattern occurs when a short term moving average, such as the 50-day moving average, crosses below a long term moving average like the 200-day moving average. When this average crosses downward, it signals a potential shift from a bullish to a bearish trend, alerting traders to the possibility of further price declines.
In technical analysis, the death cross is considered a significant chart pattern because it often marks the beginning of a downward trend or a period of increased selling pressure. Many investors and market participants view the death cross as a sell signal, using it to identify when to exit long positions or consider short strategies.
Just as the golden cross confirms bullish momentum, the death cross signals a possible reversal in market sentiment and can be a key indicator for those monitoring moving average crosses to gauge the overall market structure.
While the death cross does not guarantee a prolonged bear market, it is a widely followed technical indicator that can influence trading decisions and even become a self fulfilling prophecy as more traders react to the crossover point. Understanding both golden and death crosses helps traders navigate changing market conditions and adjust their strategies accordingly.
Trading Rules for the Golden Cross Trading Strategy?
The trading rules are simple. When the 50-day moving average crosses above the 200-day moving average, it signals a bullish breakout, and you buy. Traders often set profit targets and may take partial profits after a certain gain, such as selling 25-33% of the position after a 10-15% increase, while letting the rest run with a trailing stop. The 50-day moving average is also sometimes used as a stop-loss level, with a close below it signaling a potential end to the upward trend.
Conversely, when the 50-day moving average crosses below the 200-day moving average, it signals a bearish breakout, and you sell your position.
Let’s take a look at a trade example:
Let’s show you how a Golden Cross looks on a chart:
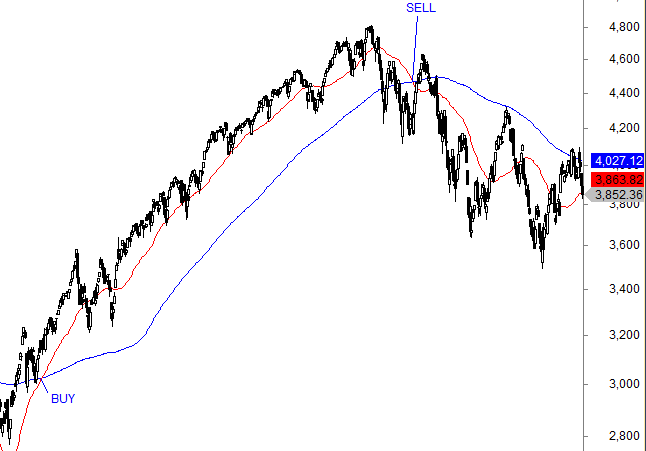
Golden Cross trading
In this example, the 50-day moving average broke above the 200-day moving average, signaling a bullish breakout. You could have bought the S&P 500 in July 2020 at 2867 and ridden the trend until you sold in March 2022 at 4173, for a nice 32.4% gain.
Of course, not all trades turn out this well! However, chasing late crossovers after significant price moves can reduce the risk-reward ratio and increase the chance of losses. From the point forward after a golden cross, it’s important to analyze price action and volume, and use other indicators such as RSI, MACD, or support levels to confirm the signal and improve trade reliability.
But how does the Golden Cross strategy perform over the long term?
Lagging Indicator
A lagging indicator is a type of technical indicator that follows price action rather than predicting it. The golden cross is a classic example of a lagging indicator because it is calculated using historical prices and only signals a trend change after the move has already begun.
This means that when the golden cross appears on a chart, the asset’s price has already experienced a significant shift, and the moving average crosses are confirming the new trend rather than forecasting it.
Lagging indicators like the golden cross are valuable for confirming the strength and direction of a trend, helping traders avoid false signals and whipsaws that can occur with more reactive indicators. However, because they react to past performance, they may not provide early warnings of reversals or optimal entry points.
For this reason, many investors combine the golden cross with other technical indicators – such as the relative strength index or trading volume – to build a more robust trading strategy that adapts to changing market conditions.
By understanding the role of lagging indicators in technical analysis, traders can better interpret the signals provided by the golden cross and use them as part of a comprehensive approach to trading and risk management.
Golden Cross Trading Strategy backtest – does it work?
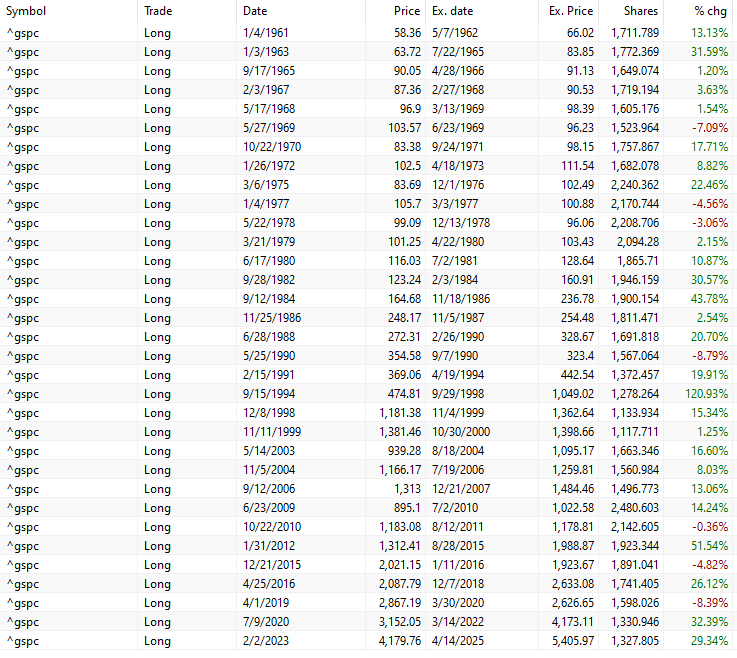
We backtested the strategy on the S&P 500 since 1960. We used the same trading rules as described above.
This is the complete trade list since 1960:
What is a Golden Cross in trading
The strategy primarily involves minimal activity, resulting in a small number of trades, only 33. Each trade lasts approximately 350 days, slightly less than 1.5 years.
It’s important to note that high trading volumes during a golden cross can reinforce the bullish signal and improve the reliability of the strategy. Additionally, the effectiveness of the golden cross trading strategy can vary depending on the asset class, as some markets and asset types respond more reliably to this indicator than others. In 2025, research indicated that golden cross patterns on major indices preceded bull rallies with approximately 68% accuracy.
Let’s look at the equity curve:
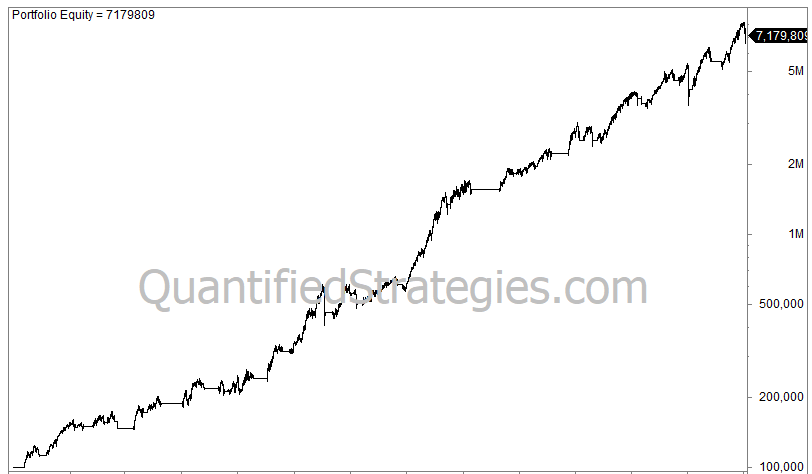
Golden Cross trading strategy
You started with 100,000 and ended up with 7.2 million 66 years later. Please remember that this backtest doesn’t include reinvested dividends; thus, the result would have been significantly better with dividends reinvested. However, it measures the result relative to the S&P 500.
Backtest Results and statistics
Let’s look at the backtest results, trading statistics, and metrics:
| Metric | Golden Cross | Buy-&-Hold |
|---|---|---|
| #Trades | 33 | 1 |
| CAGR (price-only) | 6.8% | 7.2 % |
| Time in market | 70 % | 100 % |
| Max drawdown | -33 % | -56 % |
| Trades that win (win rate) | 79 % | n/a |
| Average gain/trade | 15.8 % | n/a |
| Risk-adj. return (CAGR ÷ % time invested) | 9.6 % | 6.9 % |
We found that 79% of the trades were winners, with an average trade gain of 15.8% and an annual return of 6.8%. This, we might argue the success rate is pretty high, although what matters is the total return.
While this doesn’t beat buy-and-hold’s annual return of 7.2%, we must consider that our strategy was only invested 70% of the time.
Golden Cross’ results are impressive if we factor in the risk-adjusted return at 9.6%, which we calculate by dividing the annual return of 6.8% by the time spent in the market (0.7).
The Golden Cross strategy has substantially lower drawdowns than buy-and-hold, with only a 33% drawdown versus buy-and-hold’s 56%.
Risk Management
Proper risk management is essential when implementing any trading strategy, including those based on the golden cross pattern. While the golden cross trading strategy can help identify bullish trends and potential upward momentum, it is important to remember that no technical indicator is foolproof. Market conditions can change rapidly, and even the most reliable chart patterns can produce false signals.
To protect capital and maximize gains, traders should establish clear entry and exit points when a golden cross occurs. This often involves setting stop-loss orders below the long term moving average to limit potential losses if the trend reverses unexpectedly. Position sizing is another key aspect of risk management, ensuring that no single trade exposes the portfolio to excessive risk.
Additionally, using trailing stops can help lock in profits as the asset’s price moves higher, allowing traders to capture gains while still giving the trade room to develop. By integrating these risk management techniques into a golden cross trading strategy, traders can navigate the ups and downs of the stock market with greater confidence and discipline, making the most of bullish patterns while minimizing exposure to adverse price movements.
How do the Golden Cross and Death Cross help in reducing losses in bear markets?
The strategy aims to exploit the long-term uptrend in the stock market by staying invested during bullish periods and providing signals to exit during bearish markets, thereby reducing losses.
The Golden Cross is considered significant because it works as a trading signal, keeping investors invested in bullish markets and helping them avoid trouble during bear markets.
Conclusions:
So, there you have it, a powerful trading strategy that can help reduce your losses in bear markets and ride the bull markets.
The Golden Cross works well because it lowers the time spent in the market and, thus, drawdowns. The Golden Cross in trading is all about playing defense.
FAQ: Trading & The Golden Cross
What is the Golden Cross algorithm?
It is a technical chart pattern that occurs when a short-term moving average (typically the 50-day SMA) crosses above a long-term moving average (typically the 200-day SMA).
What is the success rate of a Golden Cross?
The success rate depends on the market. It is highly effective in trending markets but can provide “false signals” (whipsaws) during sideways or range-bound markets.
What is the best time frame for a Golden Cross?
The Daily (1D) chart is the gold standard. While it can be used on 1-hour or 4-hour charts, the signals are much more reliable on longer time horizons.
How do I trade on a Golden Cross?
Traders typically enter a Buy (Long) position once the 50-day SMA crosses above the 200-day SMA. A common tactic is to wait for the price to “retest” the 200-day line as support before entering.
How do I find Golden Cross stocks?
You can use Stock Screeners (like TradingView or Finviz). Set a filter for “Moving Average” where the “SMA 50 is above SMA 200.”
What is the success rate of a golden cross?
The success rate of the golden cross is 79% (for the S&P 500). Jump to backtest
What does a golden cross mean in trading?
The golden cross in trading means when the 50-day moving average crosses above the longer 200-day moving average.
Is Golden Cross SMA or EMA?
The Golden Cross traditionally uses Simple Moving Averages (SMA)-specifically the 50-day SMA crossing above the 200-day SMA-to signal a long-term bullish trend. While based on SMAs, traders can also use Exponential Moving Averages (EMAs) to identify the same pattern for faster, more responsive signals