
High Short Interest Indicator Strategy – Backtest
The Short Interest Strategies. Is high short interest good or bad? Short interest in trading has been a hot topic during 2021 after Gamestop made short-sellers run for cover at prices many times higher than their entry price. But was the short squeeze in Gamestop an outlier? Which stocks perform better – stocks with high or low short interest?
The empirical evidence suggests that stocks with high short interest perform worse than stocks that have little short interest. Thus, short squeezes like happened in Gamestop are not the norm – they are outliers.
We start by discussing short interest and later explain what a short squeeze is. Most indicators, including short interest, are used by traders to analyze market sentiment and potential price movements.
What is short interest? What is the short-interest ratio?
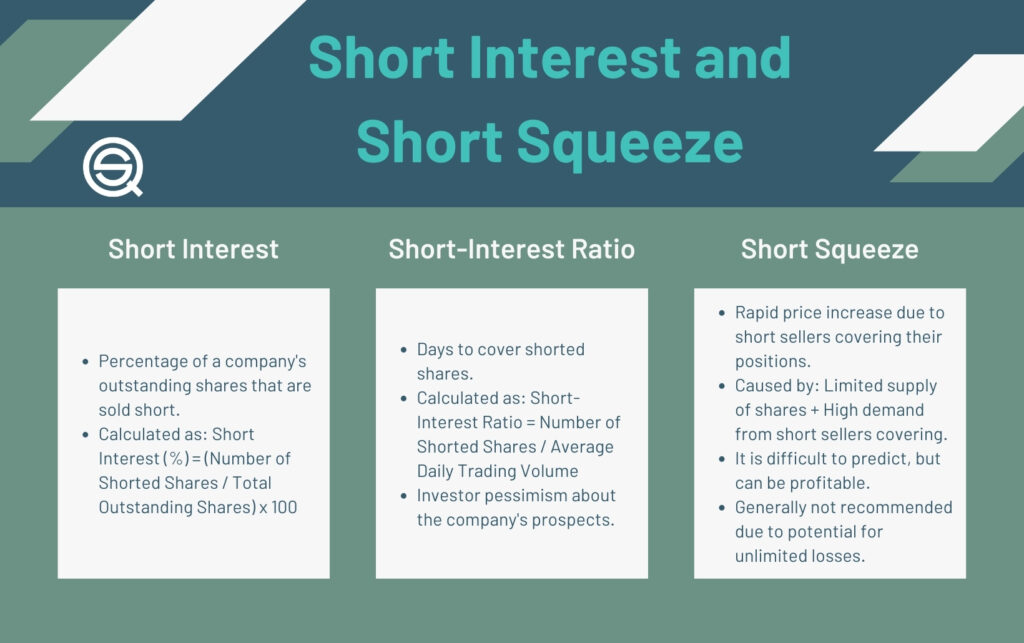
Short interest represents the total number of shares sold short (shares short) that have not yet been covered. This figure is often expressed as a percentage of the total shares outstanding, which refers to all shares available for trading.
For example, if a company has 1 billion shares outstanding and 50 million shares are sold short, the short interest is 50 million shares sold short, representing 2% of the total shares outstanding.
Short interest is thus a percentage calculated by dividing the number of shares sold short by the total number of shares outstanding.
The short-interest ratio, also known as ‘days to cover’, is calculated by dividing the total number of shares sold short by the average daily trading volume. This ratio indicates how many days it would take to cover all short positions based on average trading volume.
For example, if the short interest is 5 million shares and the daily turnover is one million shares, then the short-interest ratio is five. A higher short interest ratio suggests a larger number of days required to cover short positions, indicating a higher level of bearish sentiment. The short interest ratio can change due to fluctuations in trading volumes and the number of shares shorted.
How do you find short interest for a stock?
Short interest data is collected and reported by brokerage firms, and the Financial Industry Regulatory Authority (FINRA) oversees this process. FINRA requires broker-dealers to report their short positions twice a month. This applies to both retail accounts and proprietary trading companies. Short selling requires a margin account, which is used to borrow shares and manage short positions.
Short interest data is typically updated every two weeks, which can lead to false assumptions regarding opportunity and risk due to the lag in reporting.
What is FINRA?
FINRA was set up to protect investors and ensure the market’s integrity. It’s a government non-profit organization and regulates all broker-dealers in the US.
Because of the reporting requirement, finding the short-interest ratio in listed stocks is relatively easy. For example, the popular website Seeking Alpha has short interest listed on the landing page of every ticker.
New York Stock Exchange short interest
Based on FINRA’s biweekly reporting, the New York Stock Exchange develops a Group Short Interest file available via subscription for all the stocks listed on NYSE, ARCA, and AMEX. Short interest is often analyzed relative to the total shares available for trading – commonly referred to as short interest relative to float or outstanding shares—to provide more meaningful context than absolute figures alone.
The data can simulate risk and trading models for NYSE-listed stocks. NYSE’s numbers, or those from Compustat, are used in most of the research reports you find online. Many investors rely on third-party providers for short interest data; however, this data is not real time and is reported bi-weekly, which can make the short interest ratio less timely as a market indicator.
What is a high short interest?
A large percentage or relatively high short interest in a particular security often reflects bearish sentiment among market participants, who anticipate the price of the security to decrease. This negative market sentiment is typically seen when many investors expect the security’s price to fall.
However, it’s important to note that heavily shorted stocks can sometimes perform well despite high short interest, but generally, high short interest is associated with negative sentiment.
In June 2021, Nasdaq published an article called The Predictiveness of Short Interest. The exact level of short interest among deciles (all stocks divided/ranked into ten parts) varies across different market environments and times, but the report provided interesting insights: the most shorted stocks have a short interest of about 20%, while the lowest deciles have less than 2%. High short interest in a security is a key indicator of bearish sentiment, while low short interest indicates more bullish sentiment, with investors expecting the price to rise or remain stable:
Most likely, the short interest gives us indications about the quality of the company and the prevailing sentiment among market participants. Hedge funds are frequent short-sellers and serve a useful purpose in the market ecology: they are good at price discovery.
We argue short-sellers are needed to make a better market. Short selling is difficult and we should be happy investors are willing to compete in this challenging business.
Is High Short Interest Good Or Bad?
Let’s look at some facts and numbers instead of anecdotal evidence:
The Nasdaq article we referred to above, written by Brian Bruce and named The Predictiveness of Short Interest, the conclusion is that high short interest is followed by weak returns. Brian Bruce made the following chart (one-year returns):
The study looked at Russel 3000 stocks from 2000 until 2020.
On the left side, we see that the deciles with the highest short interest have the weakest performance. Hence, high short interest is bad for future returns. Rising short interest generally signals rising negative investor sentiment, while falling short interest sometimes suggests investors are becoming less bearish.
Anecdotal evidence might suggest that high short interest might start short squeezes (see more below), but the data above clearly illustrates that it’s not a good investment idea to buy stock with high short interest in the long run.
However, it is important to note that despite high short interest, some stocks have achieved positive returns, especially during short squeezes or unexpected rallies.
Low short interest companies outperform the average company in the universe while companies with high short interest conversely underperform.
Is the conclusion above in bold supported by other research?
The CFA institute published a report in December 2016 called Short Interest and Aggregate Stock Returns. The report looked at all stocks except small-caps from 1973 to 2014 and confirms the results above. The conclusion is pretty straightforward:
High short interest predicts a lower equity risk premium and, in turn, lower future excess returns.
What is a short squeeze?
At the beginning of the article, we mentioned that the Gamestop debacle in 2021 was a classical short squeeze. What is a short squeeze? A short squeeze looks like this (chart taken from Seeking Alpha):
A short sale involves borrowing shares and selling them with the intention of buying them back at a lower price. The stock price went ballistic in early 2021 when short sellers were required to buy back their borrowed shares. In other words:
A short squeeze happens when those that are short need to buy back the shares in the market. Traders often look for stocks with high short interest and a large number of open short positions to identify potential short squeeze opportunities.
They use indicators like total short interest, short interest percentage of float, and days to cover to gauge both risk and opportunity in these scenarios. However, high short interest alone does not guarantee a squeeze—buying pressure is necessary to trigger a short squeeze, as short sellers are forced to cover their positions.
Victor Niederhoffer had a fantastic description of a short squeeze in The Education Of A Speculator. On pages 267-268 Niederhoffer wrote this:
I signed my first client and proceeded to short my first stock. It almost proved to be my last. Over the next few weeks, I watched the stock trade up to 20, then 30, then 40, finally breaking through 50…..But when the stock climbed past 50, I started to cover, unable to stand the pain. It was too late, however, a major bear squeeze was on. I covered the last of my position between 90 and 95. I lost the entire initial $25 000 stake plus $50 000 more…..A month after we closed out our position, RH Doe declared bankruptcy. One day, shortly after the Hoe debacle, I was moping along Broadway when I ran into Wilton (“Wink”) Jaffee, and old Wall Street hand and a veteran of many campaigns. As we talked, I blurted out something about “The biggest boom and bust cycle I’ve ever seen in a stock was in Hoe”. Wink replied with a chuckle, “Oh yeah, we had some fun squeezing the shorts on that one. Really took some of those midwestern hayseeds to the cleaners.”
This anecdote highlights the risk of a short sale, where the potential loss from a short squeeze is theoretically unlimited if the price rises sharply, since there is no cap on how high a stock can go.
This is precisely what happened in many stocks during the many short squeezes in 2021, for example, in Gamestop (GME). The short-sellers were squeezed and they were forced to cover at rising prices. Sellers required higher prices to sell and the price went ballistic.
Key High Short Interest Strategies
1. The Short Squeeze Strategy (Contrarian Bullish)
Focus:
Target stocks with:
- Short interest above 20% of float
- High “Days to Cover” (Short Interest Ratio)
Catalyst:
Wait for a clear bullish trigger – earnings beats, strong guidance, unexpected news, or heavy volume inflows.
Execution:
As price rises, short sellers are forced to buy back shares to limit losses. This buying pressure compounds, creating a momentum-driven squeeze. However, as stated further down, a short squeeze strategy is very hard to time.
2. Short Interest Scanner (Contrarian Setup)
Use market scanners to identify stocks where short interest has increased over consecutive reporting periods. A rapid buildup in short positioning often signals a crowded trade. Crowded trades tend to be unstable and prone to volatility, especially if sentiment shifts.
3. Joining the Shorts (Bearish Continuation)
High short interest does not always lead to a squeeze. In many cases, it reflects persistent institutional pessimism and deteriorating fundamentals.
Approach:
Incorporate high short-interest stocks into a long-short framework by shorting names with sustained negative trends and structural weakness. Here, elevated short interest confirms bearish momentum rather than contradicting it.
Key Metrics to Monitor
Short Interest % of Float
The percentage of tradable shares currently sold short. Higher values indicate heavier bearish positioning.
Short Interest Ratio (Days to Cover)
Calculated as short interest divided by Average Daily Trading Volume (ADTV). A higher ratio implies it would take more days for shorts to exit their positions, increasing squeeze potential.
Change in Short Interest
Compare current short interest data to prior reporting periods. Rising short interest suggests growing bearish conviction and potential crowding.
Risk Management Considerations
High Volatility Risk
Short squeezes can be abrupt and extreme. Prices may rise several hundred percent in a short time frame, as observed in various “meme stock” episodes. Strict stop-loss rules and position sizing discipline are essential.
Context Matters
Short interest data should not be used in isolation. Combine it with:
- Technical structure (support/resistance, trend strength)
- Volume analysis
- Fundamental catalysts
Elevated short interest alone does not guarantee a reversal—it simply increases the probability of amplified moves when conditions align.
What triggers a short squeeze?
We suspect it’s very hard to predict a short squeeze. Using hindsight bias it’s easy to explain, but there are many stocks that have a high short interest without ever causing a short-squeeze.
High short interest begins as a catalyst for potential squeezes, especially when combined with rising prices, but traders should always consider other factors such as average volume and float size when planning trades based on short interest.
Can you profit from a short squeeze?
Traders can, of course, make huge profits from short squeezes. However, this is a trading strategy that is hard to predict. No one knows when a short squeeze is going to happen and even a high short interest might not trigger a squeeze as indicated in the research we mentioned above.
Active investors, especially those with experience in technical analysis, often use stock screeners to filter for stocks with high short interest and other relevant criteria. By combining stock screener results with technical analysis tools, they aim to identify potential short squeeze opportunities and make more informed trading decisions.
Is short selling a good strategy?
No, short selling is most likely not a good strategy, and short selling is difficult. Within the broader context of stock trading, short selling involves betting against the long-term tailwind in stocks. The stock market has risen about 10% annually for over a century, and it goes without saying that it’s hard to make money on the short side by betting against this tailwind.
Nonetheless, short-selling could be part of other stock trading strategies, like, for example, pairs trading. While shorting might not be so effective in the long run, it can still offer sound risk mitigation for a diversified investment portfolio. We have described the value of risk mitigation in a previous article about Mark Spitznagel’s Safe Haven Investing.
Even for short-term traders, you can find a few short setups that offer reasonable risk and reward. We present a few of those in our monthly Trading Edges.
Short Interest Backtesting
Backtesting short strategies often reveals a massive discrepancy between theoretical ‘paper profits’ and actual ‘real-world losses.’ This gap exists because historical market mechanics—specifically the availability and pricing of ‘hard-to-borrow’ (HTB) lists-are incredibly difficult to accurately model in retrospect.
Why the “Paper Gains” Often Disappear
To build a robust model, you have to account for the fact that shorting isn’t just “buying in reverse.” It’s a battle against math, physics, and sometimes, a mob of retail traders.
- The Cost of “Rent”: Borrow fees aren’t static. In a short squeeze, the fee can spike to 50% or 100% APR exactly when the stock price is also moving against you. A backtest using average fees will consistently lie to you.
- Asymmetric Risk Profile: When you buy a stock, your downside is capped at 100%. When you short, your downside is theoretically infinite. Most backtesting engines struggle to simulate the psychological and capital-requirement pressure of a margin call during a parabolic spike.
- The “Ungettable” Execution: High short interest often correlates with low liquidity. Your backtest might assume you covered at $50.00, but in reality, the lack of sellers means your “buy to cover” order didn’t fill until $55.00.
Key Components for a Realistic Model
If you’re looking to refine your backtest, consider these “stress tests”:
| Challenge | Solution for Backtesting |
| Variable Borrow Fees | Use historical HTB data feeds instead of flat-rate assumptions. |
| Liquidity Constraints | Cap trade sizes at a small percentage (e.g., 1-5%) of daily volume. |
| The “Pop” Risk | Run Monte Carlo simulations specifically on the tail-risk of your highest-conviction shorts. |
| Survivorship Bias | Ensure your universe includes “dead” companies that went through mergers or bankruptcy. |
Conclusion: Is High Short Interest Good Or Bad?
Is High Short Interest Good Or Bad? The empirical suggest a clear no. High short interest is bad for stocks.
The long-term empirical results suggest that high short interest is associated with lower future returns. The reason is probably simple: good companies are less likely to have their shares shorted.
For example, why would you short Visa (V)? The company most likely has a huge moat and despite high multiples, it doesn’t seem smart to short the stock.
All in all, we can safely conclude that high short interest is bad for future returns.
FAQ:
What does the short-interest ratio indicate?
Short interest is the percentage of shorted outstanding shares compared to the total outstanding shares. The short-interest ratio, also known as “days to cover,” measures the average number of days it would take for short sellers to cover their short position.
It is calculated by dividing the number of shorted shares by the average daily trading volume. For example, if a company has 1 billion outstanding shares and 50 million are sold short, the short interest is 2%.
How can I find short interest for a specific stock?
Broker-dealers are required to report their short positions twice a month, and this information is available through platforms like Seeking Alpha. Additionally, FINRA regulates broker-dealers and ensures reporting compliance. FINRA, a government non-profit organization, was established to protect investors and ensure market integrity.
To understand short interest, it’s helpful to know that a short sale involves borrowing shares and selling them with the intention of buying them back later, ideally at a lower price.
How can traders profit from a short squeeze?
A short squeeze occurs when those who are short a stock need to buy back shares in the market. It often happens when the stock price rises, and short sellers are forced to cover at higher prices, leading to a surge in demand.
Traders can potentially make significant profits from short squeezes by taking advantage of rising prices when short sellers cover their positions. However, predicting and timing short squeezes is challenging. If you plan to use options strategies to profit from a short squeeze, be sure to review the options disclosure document (ODD) before engaging in options transactions to fully understand the associated risks.