
Hindenburg Omen Indicator Trading Strategy (Backtest And Example)
Hindenburg Omen Indicator Trading Strategy: how do you use it and what is it? Stock market crashes can wipe out traders’ and investors’ profits or even put them at a huge loss in no time.
If you have been in the market long enough, you will know that stock market downturns always happen faster than the preceding or succeeding bull markets – what took the market many years to build can be wiped out in one month. As a result, traders are always looking for ways to anticipate a market downturn before it happens, and the Hindenburg Omen indicator seems to be the answer.
Widely used by financial analysts, traders, and investors alike, the indicator provides a forewarning of a market decline. Those who make use of it may be able to protect their positions before the downturn happens or even position themselves to profit from the downturn.
Related reading: Trading indicators
In this post, you will learn the following:
Key takeaways
- The Hindenburg Omen is a technical tool meant to warn of an increased probability of a stock-market crash.
- It’s not a guarantee; rather, it signals when conditions are potentially dangerous so traders can act (protect or reduce risk).
- It’s based on market breadth divergence: even when the overall index is rising, many individual stocks may be performing poorly (new lows), which indicates weak participation in the uptrend.
- The indicator relies on comparing the percentage of stocks making new 52-week highs vs. new lows.
- For a Hindenburg Omen signal to be considered “valid,” several conditions must be met:
- The broader market (e.g., NYSE Composite) must be in an uptrend (e.g., 10-week MA trending upward).
- A certain threshold of new highs and new lows must be met (typically > ~2.2% of listed stocks).
- The number of new highs must not be more than twice the number of new lows (this ensures the divergence isn’t too extreme in one direction).
- The McClellan Oscillator (a breadth oscillator) must be negative, indicating rising bearish momentum.
- When the signal is triggered, it suggests there’s increasing disagreement among market participants: some stocks are hitting new highs while others are hitting new lows.
- This kind of divergence can be a prelude to a sharp correction or crash, because the strength of the rally is not broad-based.
- False signals: The indicator can trigger without a crash following.
- Skew from non-mainstream stocks: Small-cap stocks or non-stock securities (like ETFs) may distort the signal.
- International stock impact: ETFs or foreign-stock exposures on U.S. exchanges might bias the readings.
- According to a backtest (from SentimenTrader, referenced by the article), after a Hindenburg Omen the market tends to weaken over the next 1–3 months.
- The backtest suggests that “risk/reward favors the bears” after a signal.
What is the Hindenburg Omen?
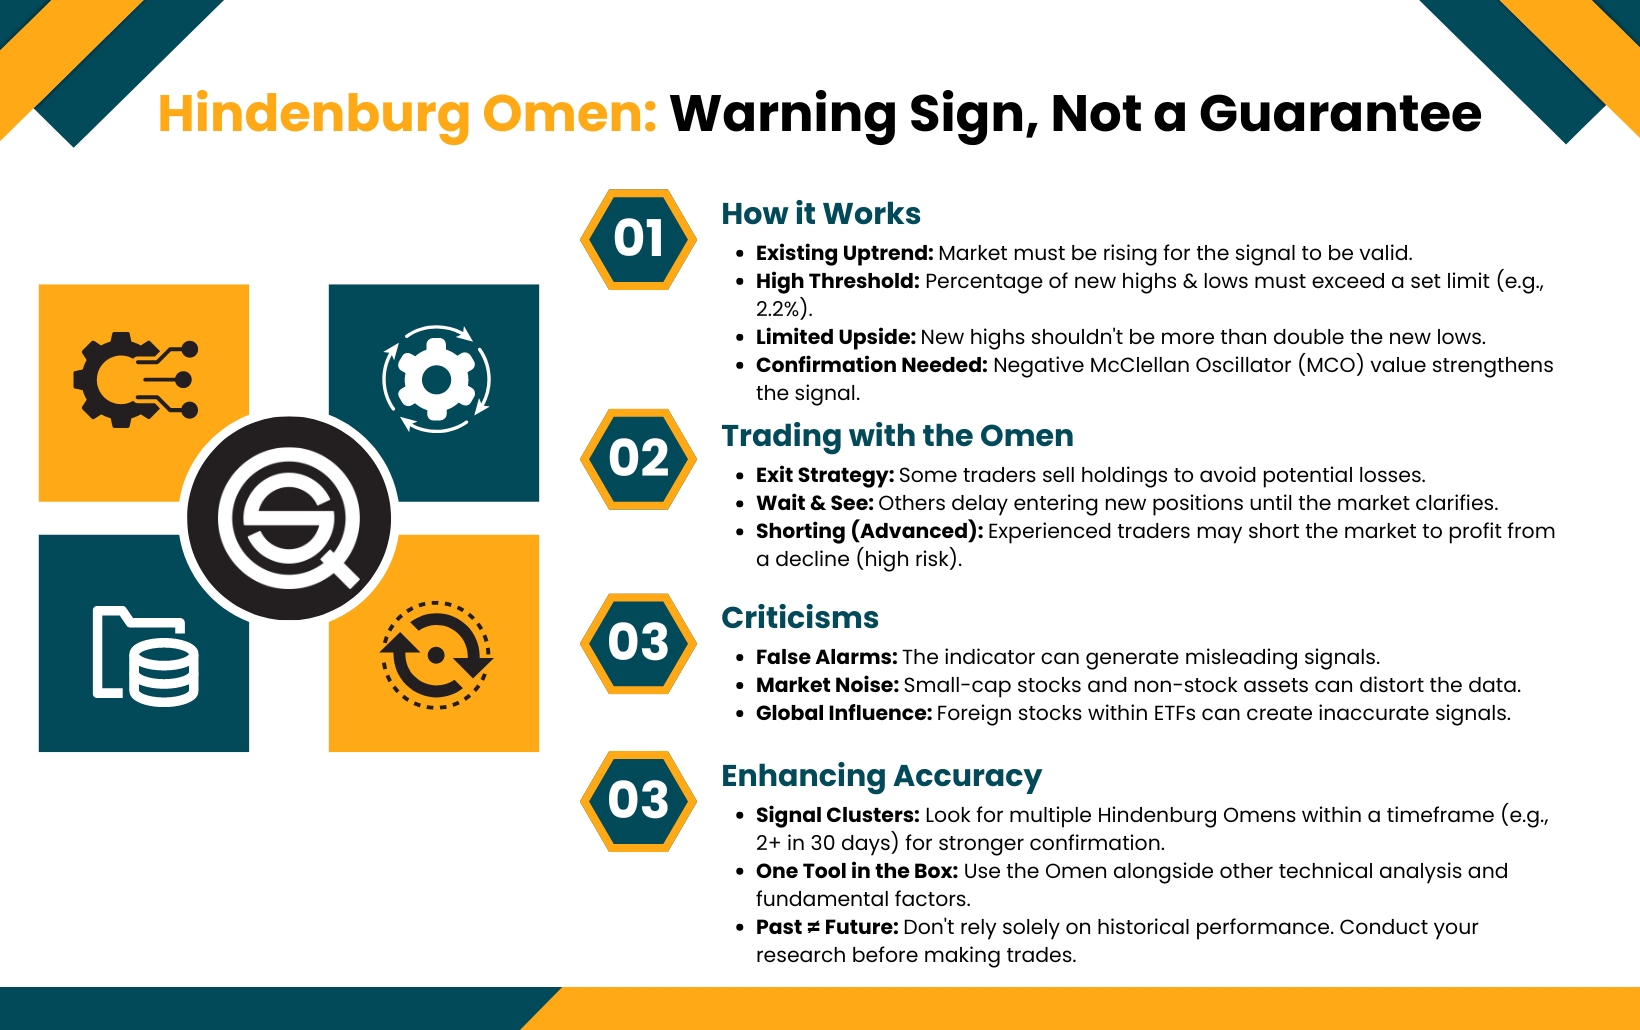
The Hindenburg Omen indicator is a technical tool that tries to predict an increased likelihood of a stock market crash by comparing the percentage of stocks making new 52-week highs and new 52-week lows to a predetermined reference percentage.
Named after Germany’s Hindenburg airship that crashed in 1937, the indicator was created by James R. Miekka but named “the Hindenburg Omen” by Kennedy Gammage of the Richland Report. While this indicator may have a funny name, it is a very serious and useful technical tool that has a good track record.
Hindenburg Omen is designed to anticipate a bearish event in the stock market. When it is triggered, the indicator warns about an imminent sharp correction or a full-blown bear market within the next 30 days, so traders can close their positions to avoid realizing major losses, stay away from the market, or position themselves to profit from the decline.
The indicator tells you when there is an increased probability of a stock market crash. It compares the percentage of new 52-week highs and lows to a predetermined reference percentage to predict the likelihood of a downturn in the stock market. But the indicator is not used alone; it has to be confirmed with other indicators that tell the direction of the market and the likelihood of increased declining stocks. For example, during the 30-day period, after the Hindenburg Omen is triggered, the McClellan Oscillator (MCO) has to be negative to confirm the bearish signal, but if the MCO remains positive, the signal is rejected.
So the indicator is not only based on market breadth theories but also on the signs of bearish tendencies in the market. In addition, the market must already be in an established uptrend for the Hindenburg Omen signal to be valid. In other words, a market crash can only be anticipated in a bull market.
Hindenburg Omen Rules and Criteria
The following criteria must be met:
- Market must be in an uptrend
- Both new highs and new lows exceed a percentage
- New highs cannot vastly exceed new lows
- McClellan Oscillator must be negative
- Optional: signals must cluster
Hindenbrug Omen Backtest and Historical Performance (Does It Work?)
We found an interesting backtest of Hindenburg Omen made by the site Sentimentrader. All credit to them. Their conclusion is that the index was “quite weak over the next 1-3 months. Risk/reward favors the bears, and the stock market falls more often than it rallies. This is as we suspected – a breadth divergence (Hindenburg Omen signal) leads to a decline in the stock market.”

How to calculate the Hindenburg Omen
The idea behind the indicator is based on the concept of market breadth divergence, which simply means that while the overall market (an exchange’s composite index) is trending in one direction, not all stocks are participating in that move. Some are making new highs, while many are also making new lows, creating a state of confusion.
There is no specific formula or calculation for the Hindenburg Omen. However, there are criteria that must be met for a Hindenburg Omen signal to be valid, and they are as follows:
- An ongoing bull market: The broad stock market index, such as the S&P 500 Index, or the composite index of the stock exchange, such as the NYSE Composite Index, should still be in an uptrend. This is verified with a 10-week moving average or a 50-day moving average that is sloping upward.
- New highs plus new lows: There is a market breadth split as the daily number of stocks making new 52-week highs and 52-week lows from among the components of the stock market index are greater than a threshold amount. Usually, 2.2 percent is used as the reference value, but some analysts may use 2.8%.
- Signs of bull weakness: Despite the overall uptrend, the bulls are not quite dominating across the entire market breadth; there are signs of bull weakness. The number of stocks making 52-week highs must not be more than two times the number making 52-week lows for the signal to be valid.
- Signs of an increasing bearish momentum: Finally, the bears must be showing signs of resurgence, as evidenced by a negative value of the McClellan Oscillator (MCO).
Understanding how the Hindenburg Omen works
As we stated earlier, the underlying concepts of the Hindenburg Omen are based on the market breadth theories developed by Norman Fosback and Gerald Appel. Market breadth theories suggest that when markets are trending upward, or creating new highs, the number of companies forming 52-week highs should be far more than the number that are experiencing 52-week lows.
On the other hand, when the market is trending downward, or creating new lows, the number of companies trading at the lowest end of their 52-week ranges should drastically outnumber the companies creating new highs.
Hindenburg Omen works as the basis of this market breadth, but it focuses on situations where the overall market trend is upward. The indicator closely monitors the number of stocks on a given stock exchange, typically the NYSE, that are recording new 52-week highs and new 52-week lows and compares these results to a standard set of criteria to show when there is a divergence in the market breadth — a situation where an ongoing bullish doesn’t cut across the entire market breadth as an increasing number of stocks are making new lows too.
The indicator gives a warning signal when greater than 2.2% of the listed stocks on the exchange are making new highs while another 2.2% (or more) are making new lows. That level of new highs and lows suggests that there is no consensus in the market since the ongoing bullish trend is not felt across the market breadth. To put it simply, the market participants are unsure of the market’s future direction.
For instance, let’s say that 160 stocks out of about 3,400 stocks (the actual number changes from time to time) on the NYSE recorded a new 52-week high today while 100 stocks recorded new 52-week lows. Dividing the values with the total number of listed stocks (3400) shows that 4.7% recorded a new high, while 2.9% recorded a new low. Since both of the results are greater than 2.2%, the basic criteria for the Hindenburg Omen have been met, and there is a warning of a market breadth split.
But like we stated earlier, the Hindenburg Omen signal has to occur in a specific setting for the signal to be valid. The creators of the Hindenburg Omen proposed several other criteria that must be met to confirm the warning signal. The first one is to confirm that the market is in an uptrend. You can do this by placing a 10-week moving average on the chart of the NYSE Composite Index and checking the direction of its slope — it must be sloping upward.
The second confirmation is that the number of stocks making new yearly highs must never be more than twice the number of stocks making new lows. In our example above, 160 is less than 200 (2×100). Finally, the third confirmation is that the popular breadth indicator, known as the McClellan oscillator, must have a negative value. This oscillator consists of a 19-day EMA and a 39-day EMA of the difference between the number of advancing and declining stocks.
After calculating the two EMAs, subtract the 39-day EMA from the 19-day EMA: a negative reading is interpreted to mean that the number of new lows has been growing faster, in recent times, than it has in the past. An easier way to confirm a negative reading is when the 39-day EMA is below the 19-day EMA. Whichever way you read it, a negative signal implies that bears are taking control and a potential correction or a full bear market could be on the way.
Example of a Hindenburg Omen Signal
An example of a Hindenburg Omen signal occurred in November 2025 when the NYSE Composite Index met all five criteria for a Hindenburg Omen: an uptrend was identified, new 52-week highs exceeded 2.2% of total issues, new 52-week lows exceeded 2.2% of total issues, the lesser of new highs or lows exceeded 2.8% of total issues, and the McClellan Oscillator turned negative. This triggered a signal, and the omen was confirmed after the same signal flashed again within 36 days.
How to use the Hindenburg Omen in your trading
There are different ways to make use of the Hindenburg Omen indicator in trading. It all depends on your style of participating in the market (investing or swing trading) and your trading situation when the Hindenburg warning signal appears. Let’s take a look at some of the basic actions traders take when this signal occurs:
Exit the market
Traders and investors who already have positions in the market may see the Hindenburg Omen signal as a warning sign to close their positions and secure whatever profits they have made at that point. Not getting out of the market may result in giving back all their profits and even ending up with a loss.
Some investors, especially the big investors, may decide not to close their positions outright but, instead, buy protective puts that would allow them an easy way out if the market crash eventually happens as predicted. A protective put allows the buyer to sell his stocks to the writer at an agreed strike price within a specified timeframe.
Delay trade entry
Investors and traders, who don’t already have a position in the market but are planning to make some trades may decide to hold on for some time to know the situation of the market before making any trading decisions.
This way, they prevent a scenario where they enter the market at the very top, just before a market crash — a situation that would have resulted in an inevitable loss. Staying away from the market allows them to preserve their capital for a better time.
Go short on the market
Some experienced traders who operate a margins account may see the Hindenburg Omen signal as a time to look for shorting opportunities in the market, considering the impending market downturn. They take short positions in the market so as to profit from the market decline.
This type of trader already has strategies they use to make their short trades, so they normally combine them with the Hindenburg Omen signal to get high probability trades.
Criticisms of the Hindenburg Omen
Many financial analysts are skeptical about the Hindenburg Omen indicator. In fact, whenever the indicator’s warning signal is triggered, you will see a bunch of analysts giving different reasons to ignore the signal. Some of their concerns are legitimate, and they include the following:
- False signals: While Hindenburg Omen has always given a signal before every major market crash in the past 35 years or more, there are many times it gives a signal without any market crash occurring.
- Small-cap stocks and non-stock issues: Skeptics also argue that the indicator can be skewed by small-cap stocks and non-stock exchange-traded funds.
- The effects of international stocks: Some traders are concerned that this indicator may be skewed by exchange-traded securities that track international stocks, which are now prevalent on U.S. stock exchanges. If all the securities (both stocks and non-stocks) listed on the NYSE or NASDAQ are used in generating the Hindenburg Omen signal, the conditions of certain foreign stocks on foreign soil can affect what the indicator says about the U.S. stock market. For example, if the ETFs tracking foreign stocks are making new lows while U.S. stocks are making new highs, the indicator might give a false warning the U.S stock market is about to experience a crash when the market itself is in good condition.
Limitations and Weaknesses of the Hindenburg Omen
The Hindenburg Omen has a dramatic name, but its real-world performance is far from perfect. Traders often misunderstand what the signal actually implies, and several structural weaknesses limit its usefulness. Below are the most important limitations you should be aware of.
High Rate of False Signals
One of the biggest weaknesses is the large number of false positives. The indicator often gives warnings during normal market conditions without any meaningful decline afterward. Even though many crashes have been preceded by a Hindenburg Omen, most omens are not followed by a crash. This makes the risk of acting too aggressively on a single signal relatively high.
Sensitive to Market Breadth Noise
The indicator relies heavily on the number of stocks making new 52-week highs and lows. This data is inherently noisy. A handful of volatile small-cap stocks or illiquid listings can distort the readings, creating a signal even if the broader market is behaving normally. Expanding ETF listings, inverse ETFs, and foreign equities listed in the US can also skew the high/low numbers.
Poor Timing Ability
Even when the omen precedes a meaningful correction, the lead time is inconsistent. The signal might appear days, weeks, or even months before the market rolls over. This makes it hard to use for precise trading decisions. It is more of a general risk warning than a tactical timing tool.
Works Best as a Cluster Signal
A single Hindenburg Omen rarely means much. Historically, clusters of signals within a limited time window are more meaningful. This creates a practical challenge because traders must decide how many signals constitute a cluster and what time span to use. Different definitions produce different outcomes.
Depends on an Uptrend Filter
One rule requires that the stock market must be in an uptrend (for example, the 10-week moving average of the NYSE Composite trending upward). But defining an uptrend is subjective. Using different moving averages or different trend definitions can cause different sets of Omen dates and therefore different results. The signal is not robust across definitions.
The McClellan Oscillator Requirement
The McClellan Oscillator must be negative for a valid Omen. Although this condition attempts to filter out noise, the oscillator itself is an intermediate-term breadth indicator with its own limitations. Oscillator noise or sudden shifts in breadth can lead to questionable signals.
Not a Standalone Trading Strategy
The Hindenburg Omen is not designed as a complete strategy. It doesn’t provide entries, exits, position sizing, or risk-management rules. It only indicates elevated risk. Many traders mistakenly treat it as a predictive system when it is fundamentally a diagnostic tool.
Market Structure Has Changed
The original criteria were created decades ago, during a market environment with fewer ETFs, fewer listings, and far less algorithmic trading. Today’s structure produces more frequent breadth divergences. This can lead to more frequent Omen triggers without the same crash implications as in the past.
Psychological Impact on Traders
Because the indicator has a frightening name, it often causes traders to overreact. Acting impulsively based on fear rather than data can lead to unnecessary hedging, premature liquidation, or missed opportunities.
A way to improve the Hindenburg Omen signal
Technical analysts and traders are always looking for ways to improve the accuracy of any given signal, and the Hindenburg Omen is no exception. In an attempt to reduce the number of false signals that are generated, traders have to use a cluster of signals over a specified timeframe rather than just one signal.
A cluster of Hindenburg Omen signals is generally deemed to mean two or more signals generated within a 30-day period. It is usually believed to be much more significant than if only one signal appears. The more signals that appear within the timeframe, the higher the likelihood of a market decline.
FAQ:
– How does the Hindenburg Omen work?
The Hindenburg Omen works by analyzing market breadth divergence, comparing the number of stocks making new highs and lows during an uptrend. The signal warns of an increased probability of a stock market crash within the next 30 days.
– What criteria must be met for a valid Hindenburg Omen signal?
The criteria include an ongoing bull market, a market breadth split with the daily number of stocks making new highs and lows exceeding a threshold (usually 2.2%), signs of bull weakness, and an increasing bearish momentum indicated by a negative McClellan Oscillator (MCO).
– What is the significance of the McClellan Oscillator in confirming the Hindenburg Omen signal?
The McClellan Oscillator must have a negative value to confirm the bearish signal. It consists of a 19-day EMA and a 39-day EMA of the difference between advancing and declining stocks, indicating an increasing bearish momentum.