How Can Volatility Indicators Help Predict Future Moves?
Volatility indicators are critical tools in financial markets, designed to measure the degree of variation in a security’s price over time.
They are particularly valuable for traders and investors seeking to predict future price movements, assess market risk, and refine trading strategies.
This article explores how volatility indicators function, their predictive capabilities, and the supporting research and statistics. The analysis is grounded in recent research and practical applications, with a focus on SEO-friendly structuring for accessibility.
Defining Volatility and Its Indicators
Volatility refers to the frequency and magnitude of price changes in a financial instrument, with high volatility indicating rapid, unpredictable movements and low volatility suggesting stability. Volatility indicators quantify this concept, enabling traders to gauge the risk associated with an asset and identify potential trading opportunities.
Related article: –4 VIX Trading Strategies
The most commonly used volatility indicators include:
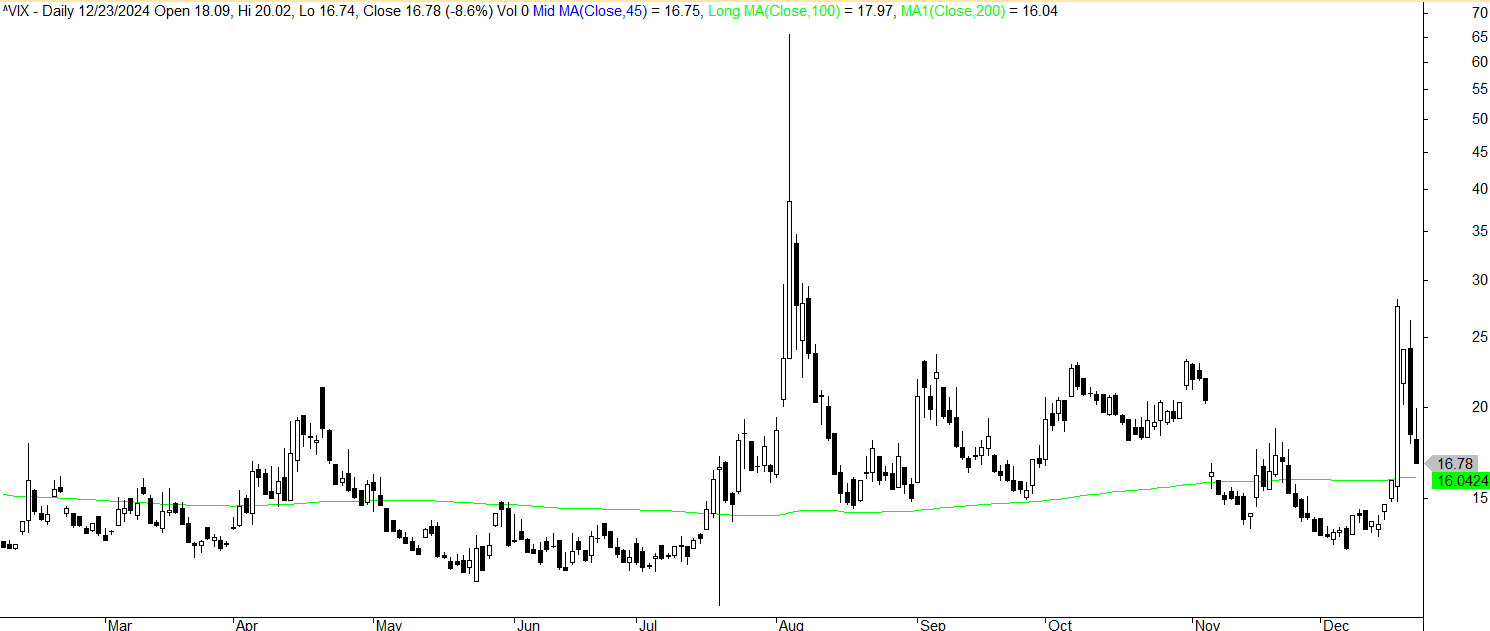
- Cboe Volatility Index (VIX): Known as the “fear index,” the VIX measures the market’s expectation of volatility over the next 30 days, derived from S&P 500 index options. It is updated every 15 seconds and reflects large institutions’ perceptions of future market risk, with typical values ranging from 12 to 35. Values above 30 indicate high volatility, while low teens suggest low volatility.
- Average True Range (ATR): Developed by J. Welles Wilder, ATR measures the average range between the high and low prices over a specified period, typically using a 14-day exponential moving average (EMA) of the true range. It is particularly useful for setting stop-loss levels and identifying potential breakouts, as higher ATR values indicate increased volatility (Average True Range).
- Bollinger Bands: Created by John Bollinger, this indicator consists of a 20-day moving average with two standard deviation lines above and below it. The width of the bands reflects volatility; wider bands suggest higher volatility and potential for larger price movements, while narrower bands indicate decreased volatility (Bollinger Bands).
These indicators are applied across various asset classes, including stocks, commodities, forex, and futures, making them versatile tools for market analysis. Our backtests indicate that these indicators are most effective for stocks.
Below is a screenshot of the VIX indicator. You can see the sudden rise and fall of market volatility:
Mechanisms of Prediction: How Volatility Indicators Work
Volatility indicators predict future price movements by providing insights risk levels. Their predictive power stems from their ability to reflect changes in market sentiment, identify potential breakouts, and signal overbought or oversold conditions. Below is a detailed breakdown:
- VIX as a Market Sentiment Indicator: The VIX is often seen as a barometer of investor fear. A rising VIX, particularly above 30, suggests increasing market uncertainty, which can precede significant downturns. Conversely, a falling VIX, especially in the low teens, may indicate complacency, potentially signaling an impending correction.
- ATR for Identifying Breakouts: When ATR values increase, it indicates that the market is becoming more volatile, which can signal a potential breakout from a trading range. Traders use ATR to set stop-loss orders, adjusting them based on the indicator’s value to manage risk during volatile periods. This is particularly useful in futures trading, where ATR helps assess potential price movement for each bar moving forward.
- Bollinger Bands for Overbought/Oversold Conditions: Bollinger Bands help identify potential reversals by showing when prices are extended relative to their moving average. When prices touch the upper band, it may indicate overbought conditions and a potential pullback, while prices touching the lower band suggest oversold conditions and a possible rebound. Widening bands indicate increased volatility, suggesting larger price movements, while narrowing bands suggest decreased volatility, potentially signaling a consolidation phase.
Research and Statistics: Evidence of Predictive Power
We have written several articles on the most relevant trading indicators, including volatility indicators. Please check out the link.
Numerous studies support the predictive capabilities of volatility indicators, though their accuracy can vary depending on market conditions and the combination of tools used. Below is a summary of key research findings, organized in a table for clarity:
| Study Source | Key Finding | Relevant Statistic/Period |
|---|---|---|
| Journal of Financial and Quantitative Analysis (Predictive Power of Stock Market Indicators) | Volatility indicators, including VIX, have predictive power for future price movements. | |
| The predictive power of stock market’s expectations volatility (Financial Synchronization Phenomenon) | Implied volatility indices predict synchronization of stock market returns, aiding trend forecasting. | Analyzed global equity indices, period not specified |
| Forecasting stock market volatility with a large number of predictors (MS-MIDAS-LASSO Model) | VIX shows strong predictive ability, though weakened during COVID-19; equity market volatility index best during pandemics. | Period: Not specified, mentions COVID-19 impact |
| Multi-model transfer function approach tuned by PSO (Predicting Implied Volatility) | OVX index outperforms other uncertainty indices in predicting VIX, with MAPE: 4.1559%, RMSE: 1.0476%, W: 96.74%. | Period: 2012–2022 |
While specific success rates are challenging to quantify due to market variability, these studies indicate that volatility indicators, particularly when combined with other predictors, can enhance forecasting accuracy.
Practical Applications in Trading Strategies
Traders leverage volatility indicators in various ways to improve their trading decisions:
- Risk Management: By understanding current volatility levels, traders can adjust position sizes and set appropriate stop-loss levels. For instance, a high ATR value might prompt tighter stop-losses to account for larger potential price swings.
- Trend Identification: Volatility indicators help identify trend strength. A decrease in volatility, as shown by narrowing Bollinger Bands, during an uptrend might suggest the trend is maturing and could be nearing its end, prompting traders to take profits. However, only a backtest can determine if this is a viable trading strategy.
- Options Trading: Volatility is crucial for options pricing, with implied volatility derived from option prices indicating whether options are overpriced or underpriced. Implied volatility is perhaps the most critical determinant of options prices.
Conclusion
Volatility indicators like VIX, ATR, and Bollinger Bands are valuable tools for predicting future price movements by providing insights into market risk and sentiment.