Linear Regression Slope – Rules, Settings, Return, Backtest
Navigating the fast-paced world of financial markets requires using tools that can show you the direction and strength of the current price trend — one tool that can help is the linear regression slope indicator. What do you know about this indicator?
The Linear Regression Slope indicator is a momentum oscillator that can show the direction and strength of the price trend. It measures the slope (the rate of change) of a linear regression line fitted to the price data of a financial security on a specific trading timeframe. The indicator’s numerical value and the direction of the plotted line may offer insight into the relative strength and direction of the price trend.
In this post, we will take a look at most of the questions you may have about the linear regression slope indicator: what it is, how it works, and how you can improve your trading strategies with it. Read on!
Key takeaways
- The Linear Regression Slope indicator is a momentum oscillator that shows the direction and strength of a price trend.
- It measures the slope (rate of change) of a linear regression line fitted to price data over a specific timeframe.
- Linear regression uses the least squares method to fit a line that predicts future values based on past data.
- The concept was developed in the early 19th century by Adrien-Marie Legendre and Carl Friedrich Gauss.
- The Linear Regression Slope indicator was later developed to analyze market trends using the slope of the regression line.
- It is plotted in the indicator window below the price chart.
- The numerical value and direction of the plotted line provide insight into trend strength and direction.
- Values above the zero line indicate an uptrend, while values below suggest a downtrend.
- The further from the zero line, the stronger the trend; the closer to zero, the weaker the trend, potentially signaling market consolidation.
- We have a complete best technical indicators for trading list.
What is the Linear Regression Slope indicator?
The Linear Regression Slope indicator is a momentum oscillator that can show the direction and strength of the price trend. It measures the slope (the rate of change) of a linear regression line fitted to the price data of a financial security on a specific trading timeframe.
Linear regression uses the concept of least squares to plot a line that helps predict future values from past values. The concept was developed in the early 19th century by mathematicians and statisticians, such as Adrien-Marie Legendre and Carl Friedrich Gauss.
However, it was much later that the Linear Regression Slope was developed as an indicator to use the slope of a linear regression line to provide insights into market trends.
Plotted in the indicator window below the price chart, its numerical value and the direction of the plotted line may offer insight into the relative strength and direction of the price trend. Values above the zero line suggest an uptrend, while values below the zero line suggest a downtrend. The further away from the zero line, the stronger the trend, while the closer to the zero line, the weaker the trend and may even suggest a consolidating market.
The lower pane shows an example of a 10-day linear regression slope:

Linear Regression Slope indicator trading strategy – rules, settings, returns, and performance
Let’s first make a simple backtest where we go long at the close when the price ends with a negative 5-day slope. We sell after N trading days (from 1 to 10 trading days). This is the result for S&P 500 (SPY):

The best result is if we exit after 9 trading days (average gain per trade is 0.39%). However, compared to buy and hold, this is not particularly good.
Let’s switch the rules and go long when the 5-day slope turns positive:

Perhaps as expected, the result turns negative to very low returns. This is because stocks tend to revert to the mean.
We backtested many other assets/ETFs, but the results are not impressive.
How does the Linear Regression Slope work?
The Linear Regression Slope works by analyzing the direction and rate of change of a linear regression line fitted to price data to provide insights into the price trend. It continuously calculates the slope value of assumed regression lines (not visibly drawn on the price chart) over a chosen number of periods and then uses it to plot an oscillating indicator in the window panel below the chart.
When the slope is positive — above the zero line — the trend is to the upside, at least in the short term. On the other hand, when the slope is negative — below the zero line — the trend is to the downside. The absolute value of the slope suggests the relative strength of the trend. Higher absolute values — whether positive or negative — suggest a stronger trend in that direction. Lower values (values closer to zero) suggest a weaker trend or even a market consolidation.
What is the purpose of the Linear Regression Slope?
The purpose of the linear regression slope is of two folds:
- Identify the trend direction: The indicator can show whether the trend appears to be moving upward or downward. Whatever side the indicator is pointing coincides with the direction of the immediate trend, at least in the short term. So, if the indicator is going up above the zero line, the trend is to the upside, and if the indicator is going down below the zero line, the trend is to the downside.
- Show the trend strength: The indicator’s absolute value can be a measure of the strength of the trend. Thus, the further away from the zero line, the stronger the trend, while the closer to the zero line, the weaker the trend and may even suggest a consolidating market.
How is the Linear Regression Slope calculated?
The Linear Regression Slope is calculated from the formula of the linear regression line, which is given as:
Y = a + bX.
Where:
- X is the variable,
- b is the slope of the line, and
- a is the intercept point.
To Calculate the value of the slope (b) from the price time series, we use this formula:
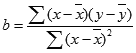
It can be broken down to
b = (N * Σ(xy) – Σx * Σy) / (N * Σ(x^2) – (Σx)^2)
Where:
- y = the asset’s closing prices
- x = the periods
- N = the number of periods in the linear regression analysis
Why is the Linear Regression Slope important for traders?
The Linear Regression Slope is important for traders because it can be used to show the direction of the current trend, as well as measure the strength of the trend. When the indicator is above the zero line and continues to rise, the trend is to the upside.
Conversely, when the indicator is below the zero line and continues to fall, the trend is to the downside. Also, the absolute value of the slope measures the strength of the trend. Given its simple interpretation, traders use it to screen stocks and other assets to find the ones with the right trend and momentum for trading.
What does a positive Linear Regression Slope indicate?
A positive Linear Regression Slope indicates that the indicator is above the zero line, which suggests that the trend is to the upside, at least in the short term. If this positive value continues to rise, then, the market keeps trending up. The higher the positive value, the stronger the uptrend.
On the flip side, the smaller this positive value gets, the weaker the uptrend. If the value is close to zero, the market may be in a tight range — in other words, the market is consolidating.
What does a negative Linear Regression Slope mean?
A negative Linear Regression Slope means that the indicator is below the zero line, which suggests that the trend is to the downside, at least in the short term. If this negative value continues to fall, then, the market keeps trending downward.
The higher the absolute value (the further away from zero), the stronger the downtrend. On the other hand, the smaller (closer to zero) this negative value gets, the weaker the downtrend. If the value is close to zero, the market may be in a tight range — in other words, market consolidation.
How can the Linear Regression Slope help in trend analysis?
The Linear Regression Slope can help in trend analysis by showing the direction and the strength of the price trend. When the slope is above the zero line and keeps rising, the trend is to the upside, at least in the short term. On the other hand, when the slope is below the zero line and keeps falling, the trend is to the downside.
Also, the absolute value of the slope suggests the relative strength of the trend. Higher absolute values — whether positive or negative — suggest a stronger trend in that direction. For instance, more negative values imply a stronger downtrend. Lower values (values closer to zero) suggest a weaker trend or even a market consolidation.
What are the key features of the Linear Regression Slope?
The key features of the Linear Regression Slope are as follows:
- The direction: One key feature of the indicator is its directionality, which can be used to know where the market is likely headed — whether the trend likely moving upward or downward. When the indicator is rising (moving upward), the trend is to the upside. Likewise, when the indicator is falling (moving downward), the trend is to the downside
- The absolute value: The absolute value of the slope is used as a measure of the relative strength of the trend, such that higher values suggest a stronger trend, while values closer to zero suggest a weaker trend or a consolidating market.
How does the Linear Regression Slope differ from moving averages?
The Linear Regression Slope differs from moving averages in many ways:
- The linear regression slope measures the rate of change of a linear regression line, which is a tool that uses the concept of least squares to plot a line to predict future values from past values in a time series. Moving averages, on the other hand, measure the average over a chosen period.
- The linear regression slope is usually plotted in an indicator window under the price chart, while moving averages are plotted as overlays on the price chart.
How can beginners use the Linear Regression Slope in trading?
For beginners to use the Linear Regression Slope in trading, they have to first understand what the indicator is and how it works so they can create reasonable trading strategies with it. Once they are able to do that, they should open a demo account and practice with paper trading.
It is important to practice their strategies until they get used to them and also have enough data showing that what they are doing works.
What timeframes are best for the Linear Regression Slope indicator?
The timeframes that are best for the Linear Regression Slope indicator will depend on your trading style and backtesting results. If you’re a day trader, you may want to use an intraday time frame, such as the hourly 30-minute, or 15-minute time frame. But if you are a swing trader, higher timeframes like the 4-hourly and daily timeframes would concern you more.
However, for whatever style of trading you are using, the easiest way to know the best time frame is to backtest different timeframes and choose the one that works best.
How can the Linear Regression Slope improve trading decisions?
How the Linear Regression Slope can improve trading decisions will depend on what a trader does with it. If the trader uses it to identify the short-term trend, then, it can help them improve trading decisions by showing them the direction to trade so they can find trade setups in that direction.
However, if a trader uses the indicator to find entry setups, they may have to use other tools to time the market better and improve their entries.
Can the Linear Regression Slope predict market reversals?
No, the Linear Regression Slope cannot predict market reversals, but it can show when the trend may have reversed, even if it is a short-term reversal. When the indicator line changes direction and crosses the zero line, the trend is likely to have reversed.
For example, if the indicator has been rising above the zero line for a while and suddenly starts falling and crosses below the zero line, the previous uptrend may have reversed, with a potential downtrend emerging.
How do you interpret the slope of a regression line in trading?
To interpret the slope of a regression line in trading, you have to consider two key aspects of the indicator: the position and direction of the indicator relative to the zero line and the absolute value of the slope. When the indicator is above the zero line and keeps rising, the trend is to the upside, and when the slope is below the zero line and keeps falling, the trend is to the downside.
The absolute value of the slope suggests the relative strength of the trend. Higher absolute values — whether positive or negative — suggest a stronger trend in that direction. So, a more negative value implies a stronger downtrend. In the same way, lower values (values closer to zero) suggest a weaker trend or even a market consolidation.
What are the advantages of using the Linear Regression Slope?
The advantages of using the Linear Regression Slope include:
- The indicator offers a clear insight into the direction and strength of the trend.
- It can be used to screen stocks and other assets to choose the right ones for trading.
- It can be easily combined with other technical analysis tools to find entry and exit setups.
- It can be used to do a multi-timeframe trend analysis by assessing the trend in different timeframes.
How does the Linear Regression Slope filter out market noise?
The Linear Regression Slope filters out market noise using the least square method applied over a specific number of periods to find the line of best fit. Depending on the periods over which it is applied, the indicator line has some lag, which helps filter out market noise to make its trading signals more reliable.
The indicator doesn’t respond to sudden and very short-term market moves until the move is persistent enough over a certain period to change the direction of the best-fit line. So, following the indicator’s signals allows you to avoid market noises.
What are common mistakes when using the Linear Regression Slope?
The common mistakes when using the Linear Regression Slope include:
- Not creating a reliable trading strategy with clear entry and exit rules
- Trading with your strategy without first backtesting it to be sure it has an edge in the market you’re trading
- Trading without an adequate risk management plan
- Risking too much per trade because you think the system is great and can make you money
- Trading in a choppy market
How can the Linear Regression Slope be used with other indicators?
To use the Linear Regression Slope with other indicators, you have to understand how the indicator works so you can combine it with other indicators that complement it. Some of the indicators you can combine with the linear regression slope include momentum oscillators and volume indicators.
With momentum oscillators, you can create entry and exit signals while using the linear regression slope to identify the trend direction. Volume indicators can be useful for trading breakouts in the direction of the trend.
Can the Linear Regression Slope be customized for different strategies?
Yes, the Linear Regression Slope be customized for different strategies if you combine it with other forms of analysis and formulate the right rules for each strategy.
One strategy may be to trade on the breakout of a chart pattern in the direction of the trend — which is identified by the linear regression slope — and ride the trend to its end. Another strategy could be to trade individual price swings with momentum oscillators.
What settings are recommended for the Linear Regression Slope?
There are no recommended settings for the Linear Regression Slope, as the right setting will vary with the trader’s strategy, trading timeframe, and market condition.
However, the default setting for the indicator on TradingView is 50 periods. It is not advisable to use this setting for your strategies. You have to backtest your strategies to find the right settings for them.
How does the Linear Regression Slope compare to the Linear Regression Channel?
Compared to the Linear Regression Channel, the linear regression slope uses the slope of the linear regression line to spot the direction of the trend and measure its strength, whereas the linear regression channel plots a channel line two standard deviations above and below the linear regression line to create an upper and lower band around the price action.
Thus, a linear regression slope may be used for trend-following, while the channel may be suitable for mean-reversion trades.
What is the difference between Linear Regression Slope and R-squared?
The difference between Linear Regression Slope and R-squared is that the former, which is proportional to the correlation coefficient, tells you how much of the change in the y-variable (price) occurs per unit change in the x-variable (time), whereas the latter tells you how well the regression line fits the data plotted. In other words, the slope is a measure of the rate of change, while the R-squared is a measure of ‘fit’.
How can the Linear Regression Slope identify potential entry and exit points?
The Linear Regression Slope can identify potential entry and exit points if combined with other forms of analysis to create a robust strategy with clear entry and exit rules.
The strategy could be to go long if the linear regression slope has crossed above the zero line and the market breaks above a key price level or a chart pattern.
Is the Linear Regression Slope effective for day traders?
Yes, the Linear Regression Slope can be effective for day traders if they use it on the right intraday timeframe and create a robust trading strategy with clear entry and exit points.
What determines how well a strategy is working is the backtesting or forward-testing result.