
Larry Connors’ Multiple Days Up And Multiple Days Down Trading Strategies
In Chapter 6 of Larry Connors’ High Probability Trading, there is a trading strategy called Multiple Days Up (MDU) and Multiple Days Down (MDD). The books by Larry Connors, including High Probability Trading, are considered key resources for traders interested in quantitative and algorithmic trading. The Multiple Days Up and Multiple Days Down strategy is one of the strategies by Larry Connors, and is based on mean reversion principles. Backtesting involves testing a trading strategy on historical data to evaluate its performance; Connors’ original tests were performed on the S&P 500 index and other ETFs.
The book was published in 2009, the trading tests were done until 31st of December 2008, and it’s time to test and check how the strategy has performed since then.
You can find the four previous strategies from Larry Connors, plus many more, on this page:
Here you can find all our Larry Connors Trading Strategies.
Table of contents:
The trading rules of the strategy:
La idea principal de esta estrategia es que los ETFs tienden a revertir a su media. Este método es una de las estrategias de mercado diseñadas para trading de corto plazo (short term) en mercados líquidos como SPY y QQQ. Debido a que los ETFs están compuestos por muchas acciones o activos, es poco probable que lleguen a valer cero, por lo que suelen funcionar mejor para estrategias de reversión a la media que las acciones individuales, las cuales sí pueden llegar a cero. Las estrategias que se enfocan en la reversión a la media suelen utilizar indicadores de precio y RSI para identificar puntos de entrada.
En esta estrategia, buscamos comprar cuando un ETF ha caído en 4 de los últimos 5 días de trading. Las reglas de trading son las siguientes:
- El cierre debe estar por debajo de la media móvil simple de 5 días antes de entrar en una operación de compra.
- El cierre debe estar por encima de la media móvil de 200 días.
- No se utiliza stop-loss en esta estrategia, lo cual es lo mismo para las estrategias MDU (Multiple Days Up) y MDD (Multiple Days Down).
El RSI de 2 períodos se utiliza para medir la velocidad del movimiento del precio; niveles extremos como RSI < 5 indican sobreventa y > 95 indican sobrecompra. En la regla de los 3 días, el RSI debe caer durante 3 días consecutivos y estar por debajo de 10 en el tercer día.
Para la estrategia de Multiple Days Down, se buscan activos que cierren a la baja durante 3 o más días consecutivos para comprar antes de un rebote alcista. Para Multiple Days Up, se buscan activos que cierren al alza durante 3 o más días consecutivos para abrir posiciones cortas antes de una corrección a la baja.
Las operaciones suelen ser de corto plazo, cerrándose a menudo en pocos días para aprovechar la reversión inmediata a la media.
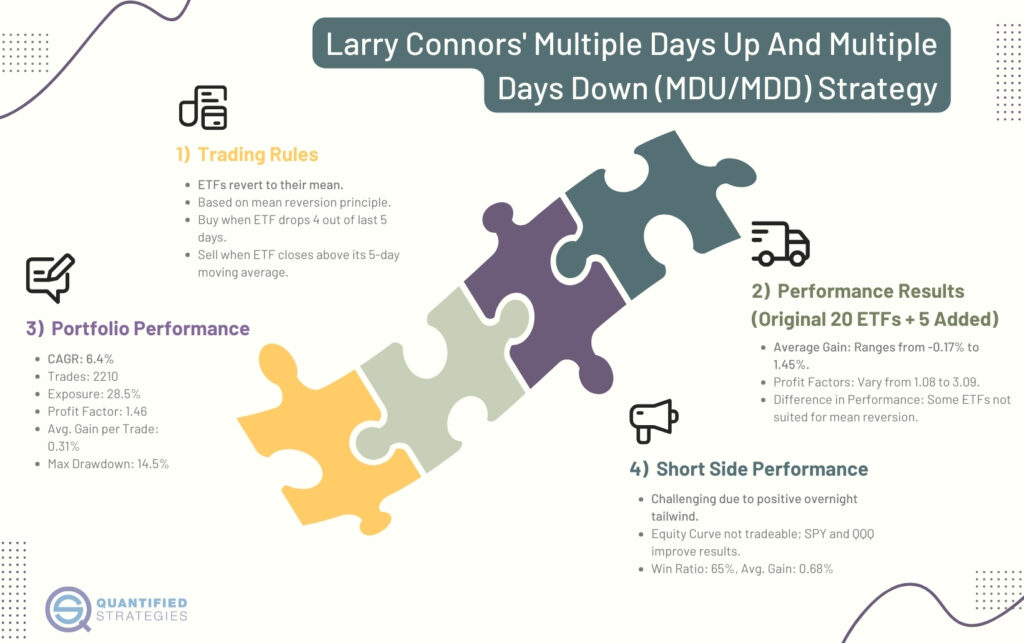
Trading Rules
- The close is above the 200-day moving average.
- The close must be below the 5-day moving average.
- The ETF must have dropped at least 4 days out of the last 5 trading days.
- If 1-3 above is true, then enter at the close.
- Sell on the close when the ETF closes above its 5-day moving average.
- No stop-loss.
If you’d like to know the code of Connors’ strategy, plus the code for all the other free strategies on this website, click here:

For more on why we use Amibroker, you might want to read this article: Thoughts on Amibroker
The results of the Multiple Days Up strategy:
Below are the results for the original 20 ETFs Connors used, and an additional five ETFs we added (results are from the inception of the ETF until December 2020):
| Result by Connors | Average gain since | Profit | ||||
| Average gain in % | inception to Nov.2020 | factor | Difference: | |||
| DIA | 0.17 | 0.19 | 1.36 | 0.02 | ||
| EEM | 0.85 | 0.43 | 1.66 | -0.42 | ||
| EFA | 0.73 | 0.52 | 2.24 | -0.21 | ||
| EWH | 0.62 | 0.17 | 1.1 | -0.45 | ||
| EWJ | 0.56 | 0.21 | 1.2 | -0.35 | ||
| EWT | 0.02 | 0.09 | 1.1 | 0.07 | ||
| EWZ | 1.45 | 1.13 | 3.09 | -0.32 | ||
| FXI | 0.88 | 0.22 | 1.19 | -0.66 | ||
| GLD | 0 | 0.35 | 1.67 | 0.35 | ||
| ILF | 1.04 | 0.98 | 2.71 | -0.06 | ||
| IWM | 0.44 | 0.36 | 1.64 | -0.08 | ||
| IYR | -0.17 | 0.03 | 1.08 | 0.2 | ||
| QQQ | 0.76 | 0.54 | 2.01 | -0.22 | ||
| SPY | 0.5 | 0.4 | 1.98 | -0.1 | ||
| XHB | 0.48 | 0.75 | 2.55 | 0.27 | ||
| XLB | 0.33 | 0.29 | 1.42 | -0.04 | ||
| XLE | 0.92 | 0.39 | 1.47 | -0.53 | ||
| XLF | 0.11 | 0.47 | 2.04 | 0.36 | ||
| XLI | 0.3 | 0.31 | 1.71 | 0.01 | ||
| XLV | 0.31 | 0.41 | 2.07 | 0.1 | ||
| ETFs not | ||||||
| included: | ||||||
| GDX | 0.38 | 1.31 | ||||
| GDXJ | 1.22 | 1.93 | ||||
| TLT | 0.22 | 1.47 | ||||
| XLP | 0.24 | 1.57 | ||||
| XME | 0.69 | 1.6 |
The last five ETFs were not part of Connors’ original test.
How does the strategy perform as a portfolio?
Most traders don’t trade just one instrument, so let’s test how the strategy performs as a portfolio.
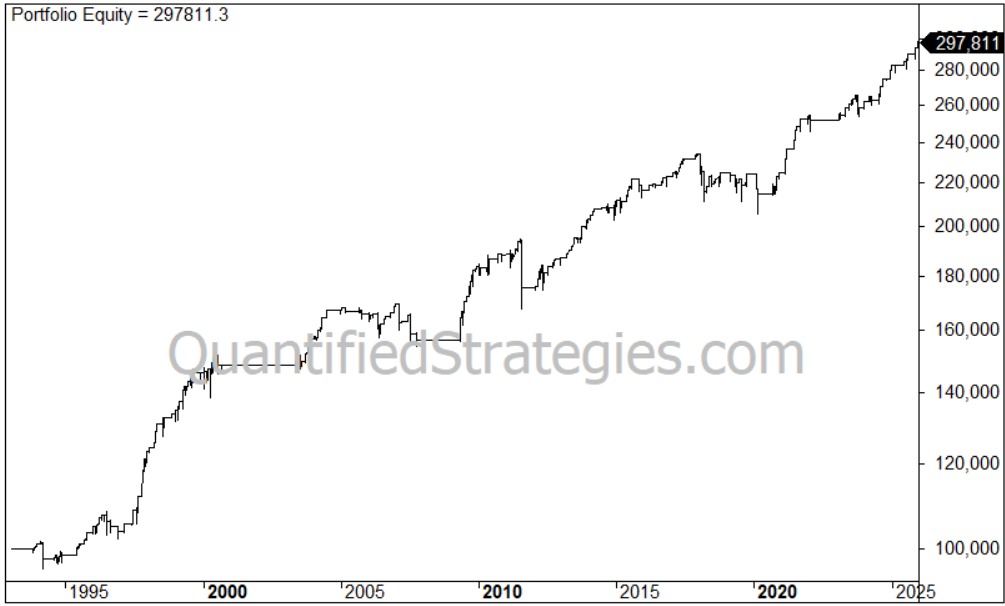
The simulation is run with a maximum of five open positions at any time, each representing 20% of the equity. This also means the capital is frequently in cash. The portfolio is simulated from 2000 through December 2020, with capital compounded (no commissions or slippage).
The equity curve looks like this:

The results can be summarized like this:
- CAGR: 6.4%
- The number of trades: 2210
- Exposure: 28.5%
- The profit factor: 1.46
- Average gain per trade: 0.31%
- Maximum drawdown: 14.5%
Compared to the other four mean reversion strategies from Connors, this one has the lowest profit factor. Several of the ETFs are most likely not suited for mean reversion, so the results can be improved.
The results in SPY:
If we change the strategy to only trade SPY, we get this compounded equity curve:
There are 264 trades, the profit factor is 2.2, the max drawdown is 13%, and the CAGR is only 3.4%. The low CAGR can partly be explained by the low time spent in the market: 9%.
How does the strategy perform on the short side
Short is always much more difficult than the long side. The reason is that stock indices have a positive tailwind overnight:
Una exit strategy efectiva es crucial para la gestión de riesgo en este tipo de operaciones. En algunas variantes, la salida se produce cuando el RSI de 2 períodos cruza por encima de 70, lo que ayuda a determinar el momento óptimo para cerrar la posición y proteger las ganancias o limitar las pérdidas.
As a portfolio of a maximum of five positions the equity curve looks like this (only shorts):
This is not tradeable, of course. If we change to only trade SPY and QQQ (having max two positions), we get this equity curve:
Much of the gain happened in 2008, but still the results are surprisingly good: the win ratio is 65% and the average gain is 0.68%.
Here you can find all our Larry Connors Trading Strategies.
Desempeño de la estrategia en diferentes condiciones de mercado
El análisis de estrategias de trading, como la propuesta por Larry Connors en su libro de high probability trading, requiere evaluar cómo se comporta la estrategia en distintos escenarios de mercado. La estrategia Multiple Days Up (MDU) y Multiple Days Down (MDD) se fundamenta en la reversión a la media, utilizando indicadores como la media móvil de 200 días y la media móvil de 5 días para definir las señales de entrada y salida. Este enfoque es especialmente relevante en el trading de ETFs, ya que estos instrumentos, al estar compuestos por múltiples activos, tienden a mostrar patrones de reversión más estables que las acciones individuales.
En mercados alcistas, la estrategia MDU y MDD suele generar oportunidades de compra cuando un ETF ha experimentado caídas consecutivas, siempre que el cierre se mantenga por encima de la 200 day moving average. Esta condición actúa como filtro para evitar operar en tendencias bajistas prolongadas, aumentando la probabilidad de éxito de la estrategia. La entrada se realiza al cierre, y la salida se produce cuando el precio supera la media móvil de 5 días, lo que permite capturar movimientos de corto plazo a favor de la reversión.
Por otro lado, en mercados bajistas, la estrategia puede adaptarse para buscar oportunidades en el lado corto, vendiendo ETFs que han subido varias jornadas consecutivas. Sin embargo, como se observa en los resultados y la equity curve, operar en corto suele ser más desafiante debido a la tendencia alcista de largo plazo de los índices y ETFs, lo que puede incrementar el drawdown y reducir el profit factor.
Un aspecto clave de esta estrategia es la ausencia de stop loss, lo que implica que el control del riesgo depende en gran medida de la robustez de las señales y de la diversificación del portafolio. Si bien esto puede permitir capturar movimientos completos de reversión, también expone al trader a pérdidas significativas si el mercado se mueve en contra de la posición. Por ello, es fundamental monitorear la curva de equity y ajustar la exposición según las condiciones del mercado y el comportamiento de cada ETF.
El backtest y la investigación muestran que la estrategia MDU y MDD puede ofrecer resultados consistentes en mercados con tendencia definida y volatilidad moderada, pero su desempeño puede verse afectado en entornos de alta volatilidad o cambios bruscos de tendencia. Por esta razón, muchos traders optan por combinar esta estrategia con otras reglas de gestión de riesgo o filtros adicionales, como el RSI o la evaluación del contexto macroeconómico.
En conclusión, la estrategia Multiple Days Up y Multiple Days Down de Larry Connors es una de las estrategias que mejor ejemplifican el enfoque de high probability etf trading basado en la reversión a la media y el uso de medias móviles. Sin embargo, como toda estrategia cuantitativa, requiere un análisis constante y ajustes según el mercado, el activo y el perfil de riesgo del trader. La clave está en entender las limitaciones y fortalezas de la estrategia, utilizando herramientas como la equity curve, el análisis de drawdown y la diversificación para maximizar los resultados y minimizar los riesgos en el trading de ETFs y otros instrumentos financieros.
Larry Connors’ Multiple Days Up And Multiple Days Down video
Multiple days up (MDU) and multiple days down (MDD) – conclusion:
Common for all strategies is that you can’t expect them to perform well on all asset classes. Each ETF has its own distinct features, and you must tweak (without data mining) to find what works on each. Hence, the Multiple Up Days and Multiple Down Days strategy can most likely be improved.
Moreover, optimization is likely to gain some more insights into the strategy.
FAQ:
What is Larry Connors’ Multiple Days Up (MDU) and Multiple Days Down (MDD) trading strategy?
Larry Connors’ MDU and MDD strategy is outlined in Chapter 6 of his book “High Probability Trading.” It focuses on mean reversion, buying when an ETF has dropped 4 out of the last 5 trading days and certain conditions are met, and selling when the ETF closes above its 5-day moving average.
How do the trading rules of the MDU and MDD strategy work?
The strategy involves buying when an ETF meets specific criteria, including being above the 200-day moving average, below the 5-day moving average, and having dropped at least 4 days out of the last 5 trading days. The sell signal occurs when the ETF closes above its 5-day moving average, and there’s no stop-loss.
What were the results of the MDU strategy on various ETFs?
Results for the MDU strategy on 20 ETFs, along with additional ones, were provided. The results included average gains, profit factors, and differences in performance. Some ETFs may not be suited for mean reversion, suggesting potential for improvement.