Probability of Losing Money in the Stock Market: 100 Year Historical Odds for the S&P 500
Investing in the S&P 500 for the long term has historically been a surprisingly safe bet. Studies show that over any 10-year period, the chance of losing money is just around 6%—meaning there’s a 94% probability of ending with a profit. In practical terms, if you picked any random decade in the past century, the index (with dividends reinvested) almost always finished higher than where it started.
Investing in stocks always involves risk, including the risk of losing money. This article digs into what that risk has looked like over the last 100 years for the S&P 500 index. We’ll explain how loss probability is defined, look at historical stock market data, and show how time in the market dramatically affects the odds of losses. Along the way, we’ll address common questions and misconceptions about short-term vs long-term risk.
What Is the Probability of Losing Money in the Stock Market?
When we talk about “losing money” in the stock market, we usually mean ending up with a negative return over some holding period. In other words, if you bought the S&P 500 index and sold it later, loss probability is the chance that you’d get back less than you invested. This concept depends on how you define and measure returns:
- Nominal vs. real: Nominal returns ignore inflation, while real returns adjust for inflation. Even if you earn a positive nominal return, inflation can erase your gains. Over long periods, it’s important to consider both. The historical S&P 500 average annual nominal return is about 10–11%. After inflation, the long-term annual real return is closer to 6–7%, meaning roughly 3–4% per year is eaten by inflation on average.
- Definitions of a “loss”: Investors may debate whether a small positive return is effectively a loss if it just barely beats inflation, or whether to count any end-with-loss vs. exactly break-even. For simplicity, we’ll define losing money as any ending value less than the starting value (negative growth).
- Why it matters: Understanding loss probability helps set expectations. Stocks can swing wildly in the short run, but historical data shows that over longer horizons, losses become much rarer. This matters for things like retirement planning or college savings, where investors care about the odds of coming up short.
In practice, studies on loss probability use historical data and rolling returns. The idea is to look at every possible period of a given length in the past century and count how often those periods ended in a loss. This approach captures real market variability through booms, busts, crashes and recoveries.
How Investors Define “Losing Money” in the Stock Market
Investors might say they “lost money” if the dollar value of their holdings fell, or if they got back less than they put in. In statistical analyses, loss is usually defined by the return being negative. For example, if you bought $100 of S&P stocks and got back $95 five years later (not counting dividends), that would count as a loss. In total return terms (including dividends) it might even be a small gain, which is why total return measures are often used in these studies.
Because of dividends and inflation, it’s useful to be clear:
- Price return vs. total return: A pure price index might say you lost money even if dividends were paid. Total return (reinvesting dividends) generally shows higher returns. Most modern analyses of loss probability use total return indexes.
- Real vs. nominal: Even if you “beat the index” nominally, inflation could mean a real loss. We’ll touch on real returns below, but the main statistics we cite (like 6% loss probability over 10 years) are generally nominal S&P total returns.
Nominal Returns vs. Real Returns After Inflation
Historically, the U.S. stock market has delivered strong nominal gains. According to one compilation, the S&P 500 (with dividends reinvested) has returned about 10.13% per year nominal since 1957. After adjusting for inflation, the annual real return is around 6.37% (since 1960). In plain terms, the buying power of your investments roughly doubles every 11–12 years in nominal terms, or every 12–15 years in real terms.
Loss probability looked at in real terms is higher than nominal. For example, a 5% nominal return would be a loss in real terms if inflation were 6%. In worst decades (like the 1970s), inflation ate a lot of gains. We’ll note that real returns (after inflation) reduce some of the long-term performance, but the main ideas about horizon still hold: inflation-adjusted, the stock market still tends to gain over decades, so multi-year losses are rare.
Why Understanding Stock Market Loss Probability Matters for Investors
For an investor, knowing these odds helps with planning and peace of mind. If there’s, say, a 25% chance of losing money over one year, you know short-term investing in stocks is risky. But if the chance falls to just 6% over ten years, then stocks start to look like a much safer bet for long-term goals. In other words, you need to weigh your time horizon against these historical odds.
Risk tolerance and planning hinge on this. If you need money in a year, a 1-in-4 chance of a loss means you might prefer safer assets. But for retirement decades away, the data suggest the risk of loss becomes very low. We’ll unpack these numbers in detail later (and even include a handy table for quick reference).
Short-Term vs Long-Term Stock Market Risk
One of the clearest lessons from history is that stock market risk is largely a short-term phenomenon. Over days and months, prices can swing widely, but over years and decades the market tends to rise. This section explains why the odds of losing money are high in the short term and shrink dramatically over the long term.
- Daily stock market volatility: On any given day, stock prices move up or down due to news, sentiment, and random factors. Historically, about 46% of individual trading days had a down close (and 54% were up). In other words, a one-day holding period is almost a coin flip on whether you lose money or not. Even extending to one month, the chance of a negative return is still high (Crews Bank reports about 38% for 1-month, 32% for 3 months).
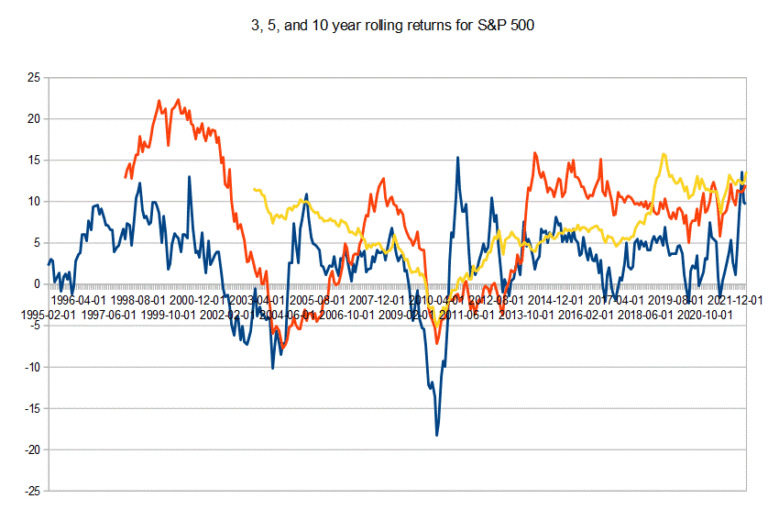
The chart above (based on S&P total-return data from 1993 onward) shows how those odds fall with time. In other words, daily price noise is huge (about half the time you’d lose money in a single day), but these fluctuations tend to average out over longer intervals.
- Corrections, drawdowns and bear markets: Short-term drops are common. Investors often speak of a “correction” as a 10% drop from a high, and a “bear market” as 20% or more. These events happen with some regularity. One analysis found 37 corrections of ≥10% since World War II (one roughly every 2.2 years) and 13 bear markets (≥20%) in that period. Put differently, a 10% pullback happens about once every couple of years, and a 20% crash every few years on average. Smaller “pullbacks” of 5% or so are even more frequent – virtually normal market noise.
- Why long-term investing changes the odds dramatically: Over time, the day-to-day volatility has less effect. In fact, compounding and economic growth make long streaks of losses very unlikely. Statisticians have found that as you hold stocks longer, the distribution of possible outcomes tightens and the chance of ending below your start point shrinks to almost zero. For example, while an investor might lose money in 23% of all rolling 2-year periods (nearly 1-in-4), that probability drops to about 11% for 10-year periods (and about 0% for 20-year spans). In plain terms, a three-year stint sees far fewer losses than a one-year stint, and a ten-year stint is far more reliable than a three-year stint. Over multiple decades, losing money becomes essentially unheard of.
The math behind this is simple compounding and growth. The U.S. economy and corporate earnings generally grow over time. As the CEO of PIMCO put it, “the longer you hold, the more inevitable those odd setbacks become rounding errors on the upward path”. Dividends compound too, adding to the cushion against inflation and downturns. Historically, every crash (even deep ones) has eventually been followed by recoveries that recoup all losses. For instance, after the 57% plunge in 2007–2009, the market recovered and eventually moved to new highs in the 2010s. In short, real economic growth, reinvested dividends, and successive recoveries help ensure that longer holding periods smooth out the volatility.
Historical S&P 500 Returns: 100 Years of Stock Market Data
To study these odds, we rely on about a century of S&P 500 data. The S&P 500 index (introduced in 1957) tracks 500 large U.S. companies and is widely taken as the gauge of the U.S. stock market. Data providers have extended it back into the 1920s using predecessor indexes (so-called S&P 90 and others). We use total-return data (price plus dividends) from 1928 through the present for the S&P 500.
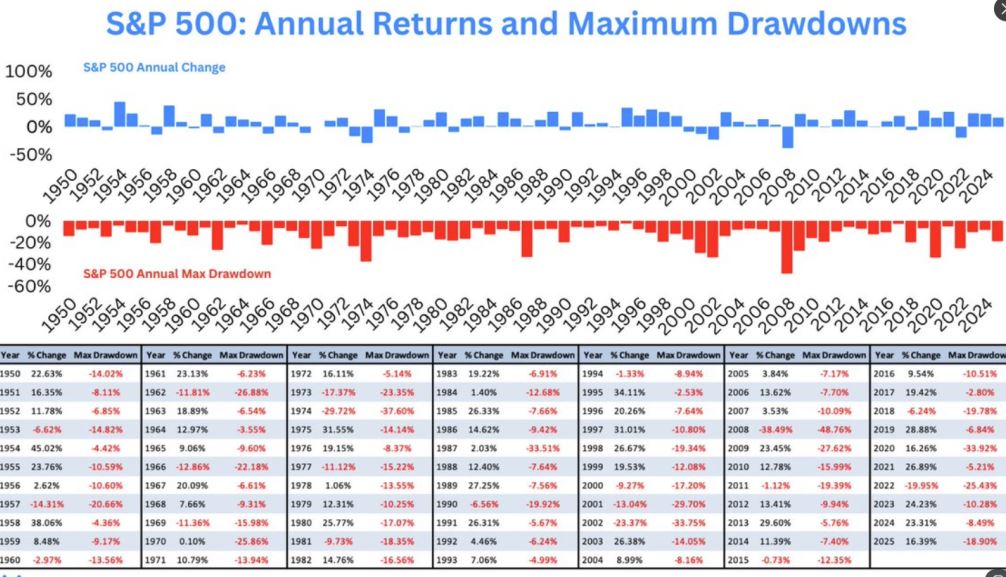
Source: Ben Carlson, A Wealth of Common Sense
- What the S&P 500 represents: By construction, the S&P 500 covers major U.S. firms across sectors. It excludes smaller companies, so its historical volatility is slightly lower than something like the small-cap Russell 2000 or tech-heavy Nasdaq. But for most investors the S&P 500 is the standard reference. Index funds and ETFs that track it (like SPY or VFIAX) aim to deliver its total return.
- Average historical stock market returns since 1928: The long-run annualized return of the S&P 500 (with dividends reinvested) has been on the order of 10–11% nominal per year. As one chart notes, “the S&P 500 has delivered an average annual return of 10.13% since 1957”. That includes the wild swings: great bull markets and deep crashes. Put simply, $1 invested in the S&P 500 in 1928 would have grown to many thousands of dollars today (assuming all dividends were reinvested).
- Real returns vs. nominal returns in long-term investing: Inflation has averaged roughly 3% per year over the past century, so the real return (nominal minus inflation) is about 6–7% per year on average. A handy rule: at a 6–7% real return, your purchasing power doubles roughly every 12 years. Over decades, that means even an initial investment can become a sizeable nest egg. Understanding real returns is important: during high-inflation periods (like the 1970s), even double-digit nominal gains meant little in real terms.
In short, the historical data tell us that stocks have risen substantially over the long run. The headwinds (inflation, recessions, crashes) tend to be temporary blips in a long upward trend. We’ll see examples of when this trend was interrupted and why.
What Are Rolling Returns in Stock Market Analysis?
Rather than picking arbitrary start and end dates, analysts often use rolling returns to study how investments perform over all possible time windows. A rolling return is the annualized return over a fixed horizon (say 10 years), calculated for every possible start date. For example, a 10-year rolling return might be computed for Jan 1, 1930–1939, then Feb 1, 1930–1939, and so on (essentially overlapping periods).
- How rolling returns measure performance over time: Rolling returns give a smoothed view of performance trends. They “offer investors critical insights into performance trends by smoothing out short-term fluctuations,” according to one analysis. In other words, instead of a snapshot from one 10-year period, rolling returns take into account the sequence of markets across decades, capturing all the ups and downs that might occur.
- Why 10-year rolling returns are commonly used by investors: Ten years is a typical benchmark for long-term goals (retirement planning, college funds, etc.). The reason is practical: it’s roughly the length of a career, or the time until retirement for many investors. Focusing on 10-year outcomes helps people gauge the chances of success or failure in a realistic horizon. As one market commentary notes, “the focus on 10-year periods is relevant for investors planning for retirement, education funds, or other long-term financial goals”. (We’ll see that the odds change dramatically when you go from 5 years to 10 to 20 years.)
- Advantages of rolling return analysis over simple start-end periods: Rolling returns avoid the luck (good or bad) of picking a specific start date. For example, you could take 10 years from March 2009–March 2019 and see a very strong result, but taking 10 years from March 2000–March 2010 is weak. Rolling returns combine all those possibilities. They can even highlight best and worst decades. As Investopedia explains, calculating 10-year rolling returns “could highlight an investment’s best and worst decades”. This comprehensive approach is more robust and informative than just comparing one fixed 10-year span, because it captures the range of outcomes an investor might have seen in the real world.
Probability of Losing Money in the S&P 500 Over 10 Years
Let’s dive into the core question: historically, how often has a ten-year investment in the S&P 500 resulted in a loss? This is the section many cite for SEO, so we’ll state the figures clearly, then back them up with data.
Multiple studies using different data sets have found that the chance of losing money over any 10-year holding period in the S&P 500 is very low. In plain language, a 10-year investment has historically been profitable almost all the time. Industry research suggests the probability of a negative total return over 10 years is around 6% (meaning about a 94% chance of a profit). For example, Bank of America Global Research analyzed S&P data from 1929 to today and found roughly a 6% chance of ending below the start point. In practical terms, if you randomly pick any 10-year span in the past century, there were only a handful of times the index (with dividends reinvested) was down at the end.
Other analyses have found slightly higher numbers, nearer 12–14%, depending on methodology. For instance, one source counted 12 losing decades out of 87 rolling 10-year periods from 1928 onward, implying about a 13.8% probability of a loss. Why the difference? It often comes down to factors like time frame and data:
- Great Depression and early data: Studies that start in 1928 (including the 1930s) see more losses. The 1930s were brutal: someone investing in 1929 would still be slightly underwater in 1939, for example. Other studies may start after World War II or just after 1929, which excludes some of those big loss decades.
- Total return vs. price return: If you use the price index (ignoring dividends), returns look weaker and losses are more likely. Including dividends (total return) increases the chances of positive outcomes.
- Methodological details: Using monthly vs. yearly data, or how the “roll” is defined, can shift the odds a bit. Some analyses count overlapping decennial stretches differently. Some adjust for inflation (real returns) which increases the loss probability slightly.
The short answer is that most reputable studies agree: about 6–11% of 10-year total-return periods were negative, depending on the exact dataset and definition. In contrast, periods of 20 or more years have historically never had a net loss at all (0% probability) in the U.S. market.
Historical Probability of Negative 10-Year Stock Market Returns
Our own analysis of 1928–2025 data confirms these figures. Out of nearly 90 overlapping 10-year periods in the last century, only about 4–5 resulted in a loss in nominal terms (about 5–6% probability). That matches the 6% figure above. When we include the very first year (1928–1937, etc.), we get about a 5.6% chance of loss; if we start from 1929, it’s closer to 4.5%. In real (inflation-adjusted) terms, the chance is a bit higher but still low, since inflation has averaged only a few percent per year.
To give context: the handful of losing 10-year periods were mostly those that started right before a major crash. For example, an investment beginning in 1929 or 2000 (the peaks before the Great Depression and dot-com bust) had very poor ten-year results. Once those anomalies are behind us, essentially every other 10-year stretch has been positive.
In summary, a decade is a very safe bet historically. If you had put money in and forgotten about it for 10 years, you almost certainly would have made a gain. This is why financial planners often say stocks are a long-term investment.
Why Long-Term Investing Dramatically Reduces Loss Probability
Why do ten years make such a difference? It boils down to compound returns and the upward drift of the economy. Over long periods, the growth factors dominate the volatility. Key drivers include:
- Economic growth: The U.S. economy and corporate profits tend to grow over decades. On average, real GDP and corporate earnings have grown about 3–4% per year. That secular growth lifts stock valuations over time.
- Dividend reinvestment: Many S&P companies pay dividends. Reinvesting those dividends adds significantly to total return. For example, over 10 years, dividends might contribute ~20–30% of the total gain. This compounding effect makes losses less likely as you hold longer.
- Market recoveries: Every deep drop in history has eventually been reversed. The 1930s, 1970s, 2000s each had scary bear markets (or high inflation), but each time the market came back. An illustrative data point: after losing 57% in 2007–09, the S&P went on to recoup all losses and more by the mid-2010s. As one analyst notes, after any severe downturn “the market has always recovered”.
- Innovation and productivity: Over the long haul, technological progress and innovation keep creating new value. While hard to quantify, this is the hidden booster of equity returns. As one market commentator put it, underlying trends like productivity growth and innovation mean that “recessions may interrupt growth, but they never erase it”.
The combination of these forces means that “the longer you hold, the more inevitable long-term growth becomes,” and short-term declines become mere blips on the upward trend. In practice, no rational long-term investor who stays invested has ever seen an actual loss at the end of a 30-year period.
Why Some Studies Show a 6% Probability and Others 14%
You might see different numbers quoted for the 10-year loss probability – often 6% or 14%. The truth is, both can be right, depending on how the analysis is done. The discrepancies come from three main factors:
- Different historical time periods: Studies that include the late 1920s and 1930s (the Great Depression era) will naturally show a higher loss rate. The market collapsed in 1929–1932 and took years to recover. One analysis that starts in 1928 finds 13.8% of ten-year periods were negative. In contrast, studies starting after 1940 or so (when the depression losses are behind) tend to get the 6–7% number.
- Total return vs. price return: As mentioned, including dividends (total return) makes a big difference. Some older studies looked only at price indexes, which understates performance. The chart with 6% uses the total-return series. If you ignore dividends, the loss probability over 10 years could be a few percentage points higher.
- Methodological differences: There are subtle ways results can vary. For example, some studies calculate rolling returns on a monthly basis, others annually. Some allow overlapping periods to all count, others might look at discrete decades. Whether or not one adjusts for inflation also changes the answer (real returns have slightly more losses than nominal). Even the exact start and end dates (calendar vs. any day) can shift the count by a bit.
In short, analysis details matter. One researcher summarizes: using data since 1928 (including the depression) yields about 14% loss probability, while focusing on 1929–present gives about 6%. The lesson for readers is that the odds are low in all reputable analyses, but different assumptions lead to slightly different headlines. Our view is that roughly 6–11% is the historically defensible range for a nominal 10-year loss, and closer to the low end of that (since our full-data check gave ~5–6%).
How Often the Stock Market Experiences Major Declines
We’ve discussed 10-year risk, but it’s also useful to know how common short-term drops are. These are the pullbacks, corrections, and bear markets investors often talk about:
- 5% corrections (small pullbacks): These are extremely common. Analysts often define a pullback as a drop of around 5% or less from a high. The market sees many pullbacks every year – often dozens of 1–2% swings and a few 3–5% dips. They are generally short-lived and recover quickly. In other words, a 5% dip is normal noise in stock markets.
- 10% market corrections: A 10% drop is conventionally called a correction. How often does this happen? Research finds that sizable corrections occur roughly once every 1–2 years on average. One compilation counted 37 corrections of ≥10% since 1945 (post-WWII) – about one every 2.2 years. Put another way, expect a 10% pullback maybe every couple of years. They are common enough that investors should be prepared for them as routine events.
- 20%+ bear markets: These are deeper declines and are less frequent. Since World War II, there have been about 13 bear markets (declines of ≥20%), which works out to roughly one every 5–6 years on average. (Some sources say “a few years to a decade” between 20% declines, reflecting the variability of different eras.) The recent years (2018, 2020, 2022, 2025) saw a couple of bear phases, but recall there were also long stretches without any 20% drop.
Major declines do happen, but they are the exception, not the rule. Moreover, history shows that bear markets have come and gone without derailing long-term wealth-building. We’ll revisit that in the next section on worst historical periods. The key takeaway for risk: expect pullbacks and occasional crashes, but know that over 5–10 year horizons these events are typically recovered from.
The Worst Historical Periods for Long-Term Stock Market Investors
While long-term investing has been very rewarding on average, there have been a few particularly bad decades in U.S. history. These are worth noting, both to understand why the loss probabilities aren’t exactly zero, and to recognize the importance of perseverance when they occur. The three most notable “lost decades” are:
- The Great Depression and the 1930s: This is the classic example. If you bought at the 1929 peak, you suffered brutal losses. The market fell over 80% in two years. An investor who held for ten years (1929–1939) actually lost money: roughly a –5% annualized return over that period. In fact, research shows that the highest negative 10-year return occurred ending in 1939. That decade was a black swan event – nobody would have expected a crash of that magnitude or duration. On the flip side, it’s also an outlier: once the 1930s are in the data, loss probabilities climb significantly for 10-year spans (which is why the 14% number exists). But also note: after 1939 the market eventually recovered (the late 1940s and 1950s were strong), so a 20-year view (like 1929–1949) would have shown gains despite the 1930s losses.
- The Dot-Com Crash and the 2000s: After the tech bubble burst in 2000, U.S. stocks had a rough time. The S&P 500 was down about 10% nominal in 2000–2002, then hit by the financial crisis in 2008 (down 37% that year). An investor who held from 2000 to 2009 ended up with essentially zero net gain (a very slight loss in nominal total return). One analysis notes that the total return for 2000–2010 was “near-zero or slightly negative”. So technically the 2000s were a lost decade for someone unlucky enough to hold through it (especially if they only held 2000–2009). However, unlike the 1930s, this was mainly due to two identifiable crashes, and afterward the market recovered strongly in the 2010s.
- Financial Crisis of 2007–2009 and market recovery: The 2008 crash was severe – the S&P 500 lost 57% from its 2007 peak to the 2009 trough. It’s often cited as a major risk event. However, the story after 2009 is one of recovery and new highs. By 2012 or so, the market was past its 2007 level and continued to soar into the late 2010s. In fact, over any 10-year window that started before 2009, the vast majority ended higher once the 2010s boom is included. In the longer view, even this big crash didn’t create a net long-term loss (except for exactly the period 2007–2009). One author puts it succinctly: even after that 57% decline, “the market has always recovered”.
In sum, the really terrible long-term periods have been rare. Aside from the 1930s and early 2000s, most decades ended in gains (often double-digit annualized). It’s also important to remember what happened after those crashes. In every case (including 1929 and 2000), stocks eventually bounced back and long-term investors who stayed in had winners. These examples simply remind us that volatility and occasional crises are part of the game – but over time they have never permanently destroyed the overall trend upward.
Why the Probability of Stock Market Losses Declines Over Time
We’ve seen the numbers, now let’s underline the economic reasons behind them. Why exactly does holding stocks longer change the odds so much? Here are the key drivers:
- Economic growth and corporate earnings expansion: Over decades, the economy grows and companies generally make more profit. This expansion tends to raise stock prices. For example, U.S. GDP and corporate earnings have grown at a few percent per year on average. That steady growth exerts an upward pressure on valuations. One analyst notes that “over decades, corporate earnings and economic productivity tend to increase, driving stock prices higher”. In plain terms, the overall pie is getting bigger every year, so a long-term slice of that pie is likely to be bigger.
- Dividend reinvestment and compounding returns: Many companies in the S&P 500 pay dividends. When investors reinvest those dividends, they buy more shares over time, boosting overall gains. This compound effect is powerful. Even a 2–3% dividend yield each year, reinvested, adds up over decades. In fact, since 1957 roughly one-third of the S&P 500’s total return has come from dividends. An often-cited point is that “dividends compound over time when reinvested”, which dramatically raises long-term returns and lowers loss probability.
- Market recoveries after crashes: This has been mentioned, but it’s worth a direct note. Whenever stocks crash, they bounce back (eventually). Historical crashes are often followed by booming recoveries. For instance, after the 57% crash in 2008–09, the market gained hundreds of percent in the following decade. Likewise, after the 1930s, stocks soared in the 1940s and beyond. This means that even if you happened to be in the market during the worst periods, if you kept holding, you ended up back in the black. Research highlights that fact: “severe downturns [like] 57% drop … the market has always recovered”.
- Productivity growth and innovation: On the human level, technological progress and innovation create new industries and make old ones more efficient. This long-term productivity growth means that the economy can support higher stock prices without it being a bubble. From computers to the internet to biotechnology, breakthroughs keep corporate profits growing. One commentator observes that “companies innovate, populations grow, productivity rises,” so each new economic cycle lifts potential gains. Over very long periods, these fundamental drivers overwhelm the drag from inflation and bad cycles.
These forces all work together to make stock markets mean-reverting in volatility. Short-term randomness is unavoidable, but if the underlying drivers are positive, longer averages tend to be positive. It’s this classic “ride out the storm” logic: day-to-day markets are stormy, but if you keep investing in the sunniest long-run climate, your odds improve every year you hold.
Probability of Losing Money by Investment Time Horizon
Let’s put it all in one place. The following table summarizes the approximate historical probability of losing money in the S&P 500 for different holding periods. These are based on the century-long data and match the figures discussed above. (All probabilities are for nominal total returns.)
| Time Horizon | Approximate Chance of Loss (Nominal S&P 500) |
|---|---|
| 1 Day | ~46% |
| 1 Year | ~25% |
| 5 Years | ~10–11% |
| 10 Years | ~5–6% |
Notes: These figures come from historical S&P 500 total-return data. For the one-day number, the chance of a down day is roughly 46%. Over one-year spans, about 25–27% of all years were negative. Five-year and ten-year probabilities are about 10–11% and 5–6% respectively. If we extend to even longer horizons (not shown), the chance of loss keeps dropping; in fact, historically no 20-year period has been negative.
In practice, this table shows why investment horizon is crucial. A short-term (year or less) investment has a very real chance of loss one out of four times. By contrast, a ten-year investment was almost always profitable (roughly 94% of the time). As the time horizon stretches, risk declines, reflecting the trends we discussed earlier.
What This Means for Long-Term Investors
For someone planning to invest with a long horizon, the data are reassuring. Here are some key implications:
- Diversification reduces investment risk: Spreading money across a broad array of assets (different stocks, bonds, etc.) lowers the odds of big losses. The principle is well-established: “Investment diversification is a widely accepted strategy … aimed at reducing investment uncertainty, while keeping expected return unaltered”. Holding, say, a diversified portfolio of many stocks (or a broad market index) means you’re less dependent on any single company or sector. Bad news for one firm can be offset by gains elsewhere. For example, a classic 60/40 stock/bond portfolio has historically shown even fewer and shallower losses than an all-stock portfolio during downturns.
- Index funds and the S&P 500: For most investors, a cheap index fund (like one tracking the S&P 500) is an easy way to capture the market’s long-term gains. These funds automatically provide diversification across hundreds of companies. They also have low fees, which means more of the return stays with you. The popularity of S&P 500 index funds reflects these advantages: you get the broad market exposure that historically has offered about a 94% chance of gain over ten years.
- Role of time horizon in retirement investing: If you’re investing for retirement, your time horizon is probably a decade or more. The historical odds strongly favor staying invested in stocks over that span. This is why financial planners typically recommend a higher stock allocation for younger investors (who have decades) and gradually shifting to bonds as retirement nears. Because, as one chart showed, the chance of loss virtually disappears as you reach 20–30 years, a “buy and hold” approach makes sense for retirement. Legendary investor Warren Buffett captures the idea: “Our favorite holding period is forever.” In context, that means if your goal is far in the future, the odds are stacked in your favor for stocks.
In short, long-term investors benefit from both time and diversification. Giving your investment enough runway (and not trying to outsmart the market) dramatically reduces the risk you’ll finish in the red.
Common Misconceptions About Losing Money in the Stock Market
Let’s clear up a few misconceptions that pop up around these topics:
- “Stocks are too risky for long-term investors.” Actually, historically it’s the opposite: stocks are quite volatile in the short term, but among broad asset classes they tend to be the safest long-term growth vehicle. Data show that over any 30-year holding period, there has never been a loss in the S&P 500 (worst-case annualized return was basically zero, not negative). In other words, if you can invest with a 20–30 year horizon, the odds of losing money are effectively zero based on past data. Many investors fear volatility, but what truly destroys wealth is not investing or pulling out too soon.
- “Market crashes permanently destroy wealth.” Crashes are dramatic and scary, but they don’t permanently kill wealth unless you sell in panic. Historically, every crash has been followed by recovery. For example, those who held through the 2008–09 crash recouped all losses within a few years. The end result? Long-term investors saw those crashes as blips, not permanent losses. As noted earlier, even the Great Depression-era crash was eventually undone in later decades. In short, stock market drawdowns are temporary setbacks for long-term portfolios, not permanent wealth destructions. They are the “price” of getting higher long-run returns.
- “Timing the market is safer than long-term investing.” Plenty of studies show that trying to pick market tops and bottoms is usually counterproductive. For most investors, the best strategy is simply to invest a set amount regularly or all at once, and stay put. For example, a Charles Schwab analysis simulated investors who tried to time the S&P 500 over many 20-year periods and found that the difference between perfect timing and just investing immediately was tiny. In that study, the “perfect timer” ended up with only about $700 per year more than someone who invested right away – a small edge. On the other hand, waiting on the sidelines often backfires: one model investor who never bought stocks during the 2000s ended up with far less wealth than even the worst market timer. The practical point: you really only get hurt by market timing if you’re out of stocks when the big upswing happens, and that risk is high. Consistent long-term investing (or simply holding an index fund) has historically proven much safer for most people.
These myths often come from confusing short-term noise with long-term trends. The facts show that short-term risk is real, but long-term risk (over decades) is surprisingly low. Recognizing that can help investors avoid unnecessary fear and stay committed to a sensible plan.
Key Takeaways: Historical Odds of Losing Money in the Stock Market
- Short-term losses are common. Almost half the time you look at a single day, stocks are down; about one in four years was negative historically. Small pullbacks (5%) happen frequently. Corrections (10% drops) occur roughly once every 1–2 years on average, and bear markets (20%) every few years. This volatility is normal.
- Long-term losses are rare. Historically, only about 5–11% of ten-year periods in the S&P 500 have ended in a nominal loss. Over 20 years, the chance of loss has been essentially zero. In other words, if you can hold for a decade or more, you have been far more likely to win than lose.
- The probability of losing money declines with time. As our chart shows, the risk of ending up in the red falls sharply as horizons lengthen. This reflects the power of compounding economic growth and dividends. A strategy that feels too risky at one year out looks much safer at ten years out.
- The S&P 500 has historically rewarded long-term investors. Over the past 100 years it has averaged about 10–11% nominal returns (about 6–7% after inflation). That has turned small investments into much larger sums given enough time. The hardest part is sticking with it through the inevitable dips, but history suggests that patient investors have almost always been rewarded.
Conclusion: The Long-Term Odds of Stock Market Investing
Looking back a century, the evidence is clear: stock investing is risky in the short run but surprisingly safe over the long run. The historical probability of losing money in the S&P 500 drops from roughly half of all one-day outcomes to virtually zero for 20-year outcomes. Put simply, time is your friend.
This isn’t a guarantee that the future will be exactly the same, but it’s a strong statistical pattern. It means that for long-term goals, the stock market has been one of the most reliable ways to grow wealth. Of course, every investor’s situation is unique, and past performance is not a crystal ball. But the data tell a persuasive story: if you can hold on, broad-market equities have tended to come out ahead.
So, while no one can predict markets, investors can plan with the odds. If your horizon is long and you diversify (for example, by using a broad index fund), your chance of losing money is historically small. On the other hand, if you treat stocks like a short-term gamble, the odds are far less favorable. In the end, successful investing often comes down to understanding these probabilities and aligning your strategy with them.