Sentiment Analysis Trading: Your Daily Bias, Without the Guesswork
Every morning you ask the same question: what’s the market bias today?
Most traders answer it by glancing at one chart, scrolling headlines, peeking at overnight futures, or trusting a gut feel.
That’s a problem. You’re making a day-defining decision on incomplete data.
Sentiment analysis trading fixes that. It gives you a data-driven market bias pulled from multiple assets and proven intraday setups – so you stop fighting the tape and start trading with it.
Table of contents
- What is sentiment analysis trading?
- The daily problem every trader faces
- How edgeful’s new overall daily bias bar is removing uncertainty
- How it works: three market scenarios
- bullish (65%+ green)
- bearish (65%+ red)
- neutral / choppy (mixed)
- The data that powers it
- How to use it in your morning routine
- Why it matters for day traders
- Getting started
- FAQ
What is sentiment analysis trading?
A simple way to set directional bias by aggregating bullish vs. bearish signals across many symbols and a few high-probability strategies. Instead of reacting to one indicator or a headline, you look at live signals from major market movers and let the majority set your bias before you place a single trade.
It answers the most important question you have each day: Am I bullish, bearish, or sitting out?
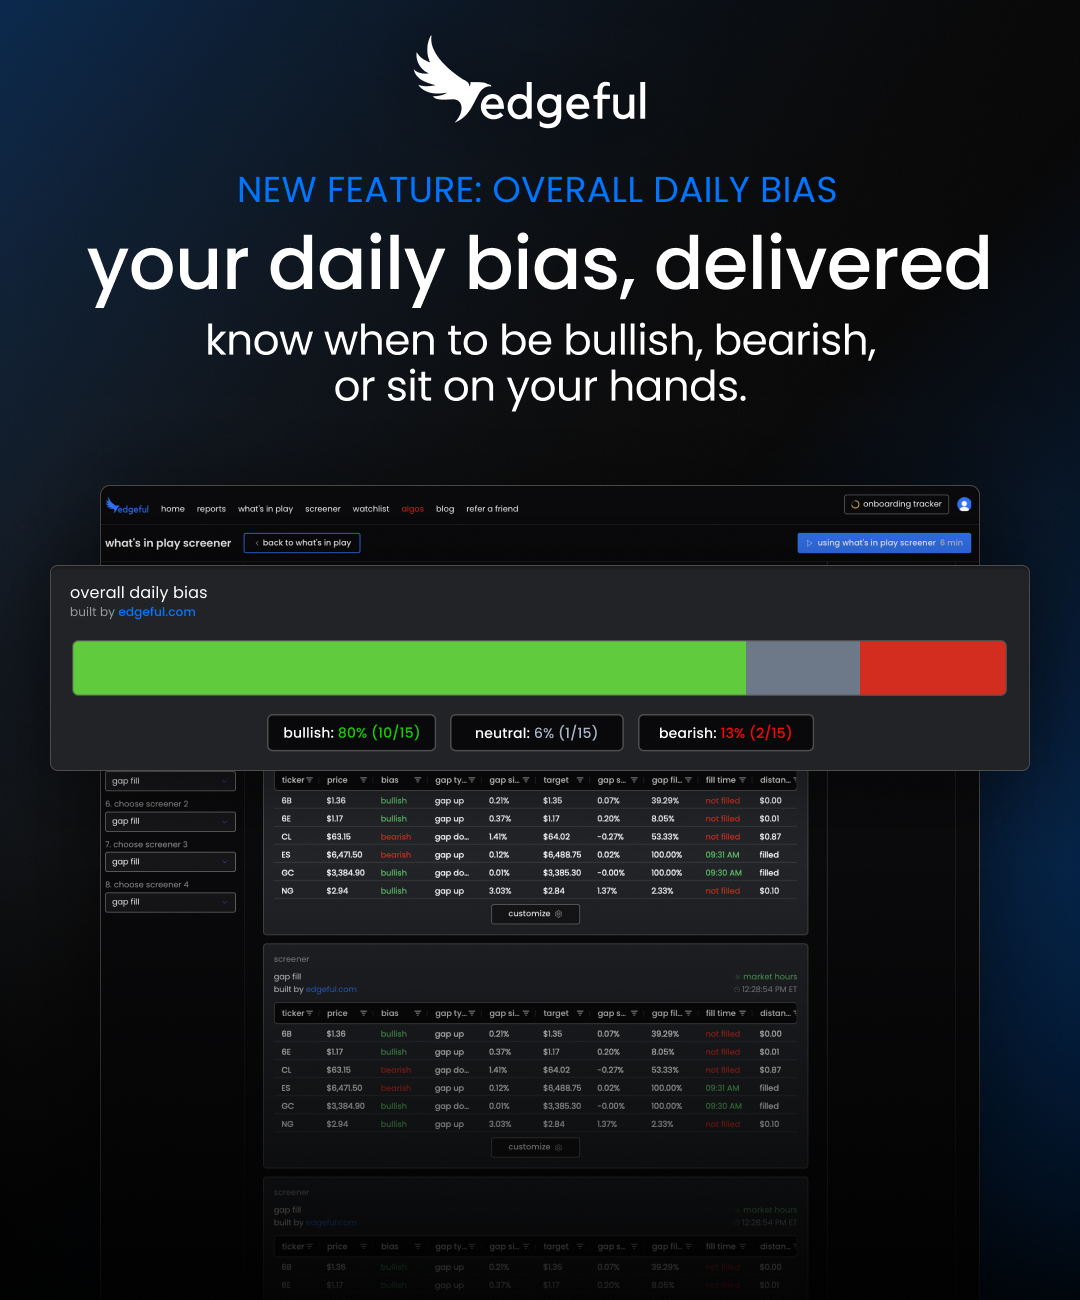
How edgeful’s new overall daily bias bar is removing uncertainty
Overall daily bias: your daily bias, delivered
edgeful just pushed this to all edgeful members, and it will immediately improve how you approach the market.
Introducing the overall daily bias bar.
Here’s what it does:
It aggregates the bullish/bearish bias across all the tickers and reports you have selected in your What’s in Play screener.
Instead of guessing what the market bias is, you get it delivered in one glance, using data — not opinion.
The daily problem every trader faces
You’ve watched traders short all day on a clearly bullish tape. You’ve watched them buy dips on a day that was screaming red.
They weren’t “unlucky.” They were trading against the market, not with it.
Sentiment analysis trading removes the emotion. It gives traders objective bias based on what the data shows – not what they feel.
How it works: three market scenarios
Every session you’ll get one of three reads. Here’s what each means and how to respond.
1) Bullish (65%+ green)
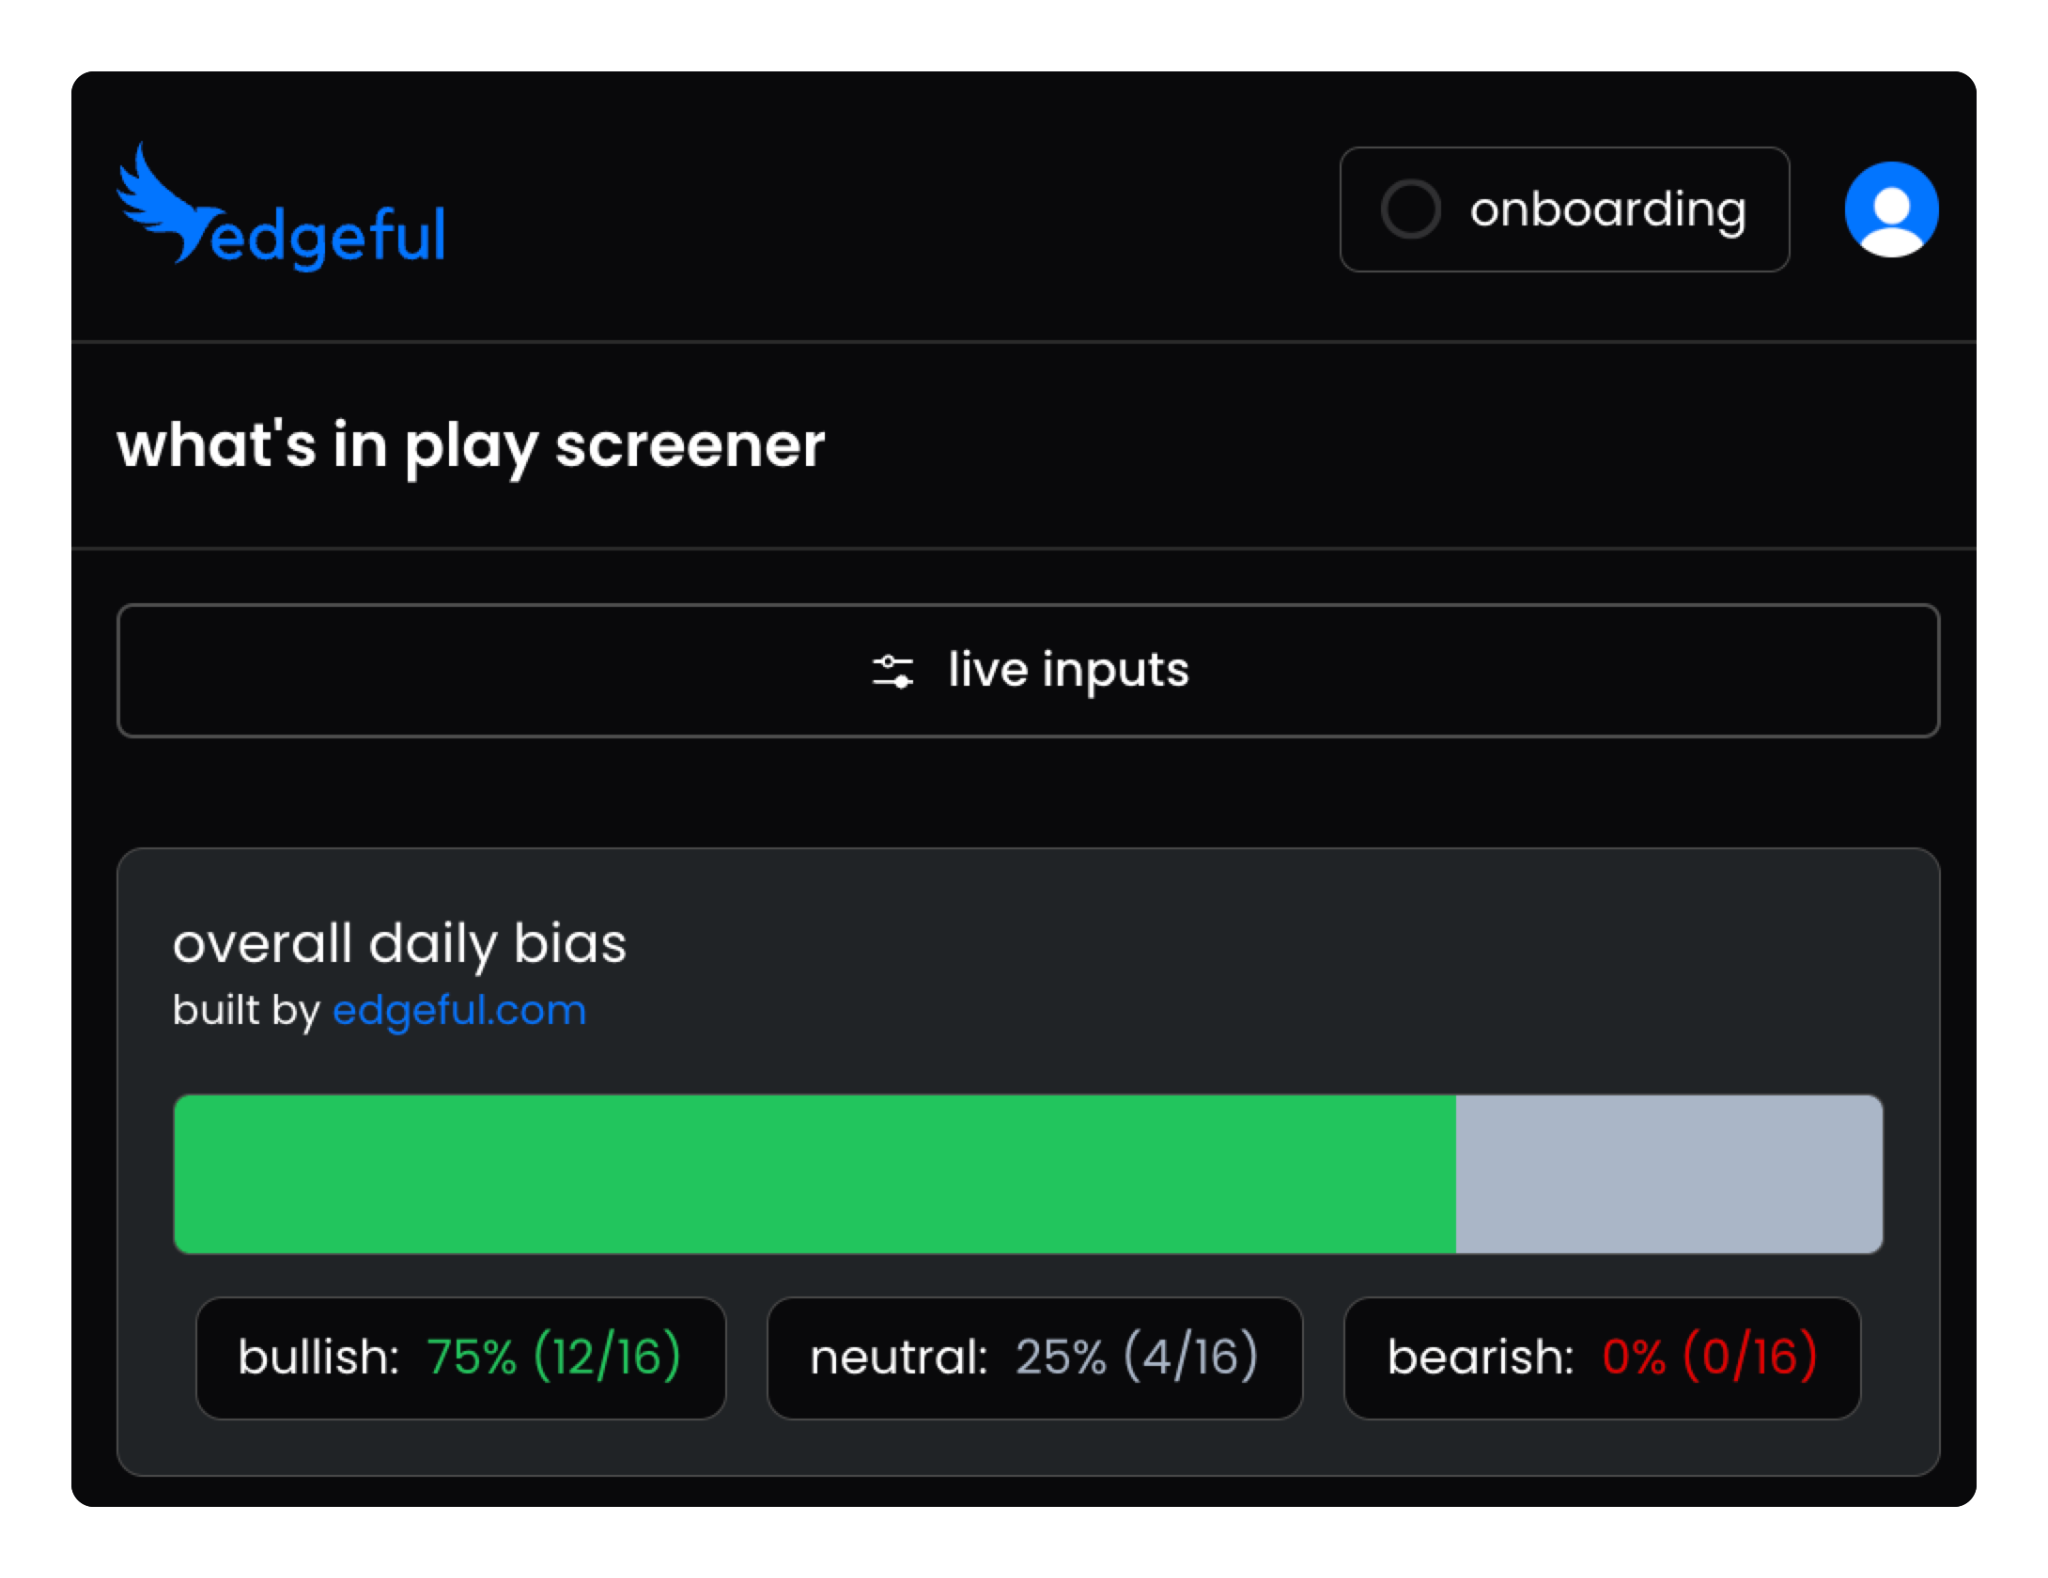
What the data says:
- The majority of tracked symbols/strategies are green (e.g., 12+ of your 16 tickers).
How to trade it:
- Stay with the trend
- Look for longs on your names
- Avoid counter-trend shorts just because something looks “extended”
Translation: don’t overthink it – go with it.
2) Bearish (65%+ red)
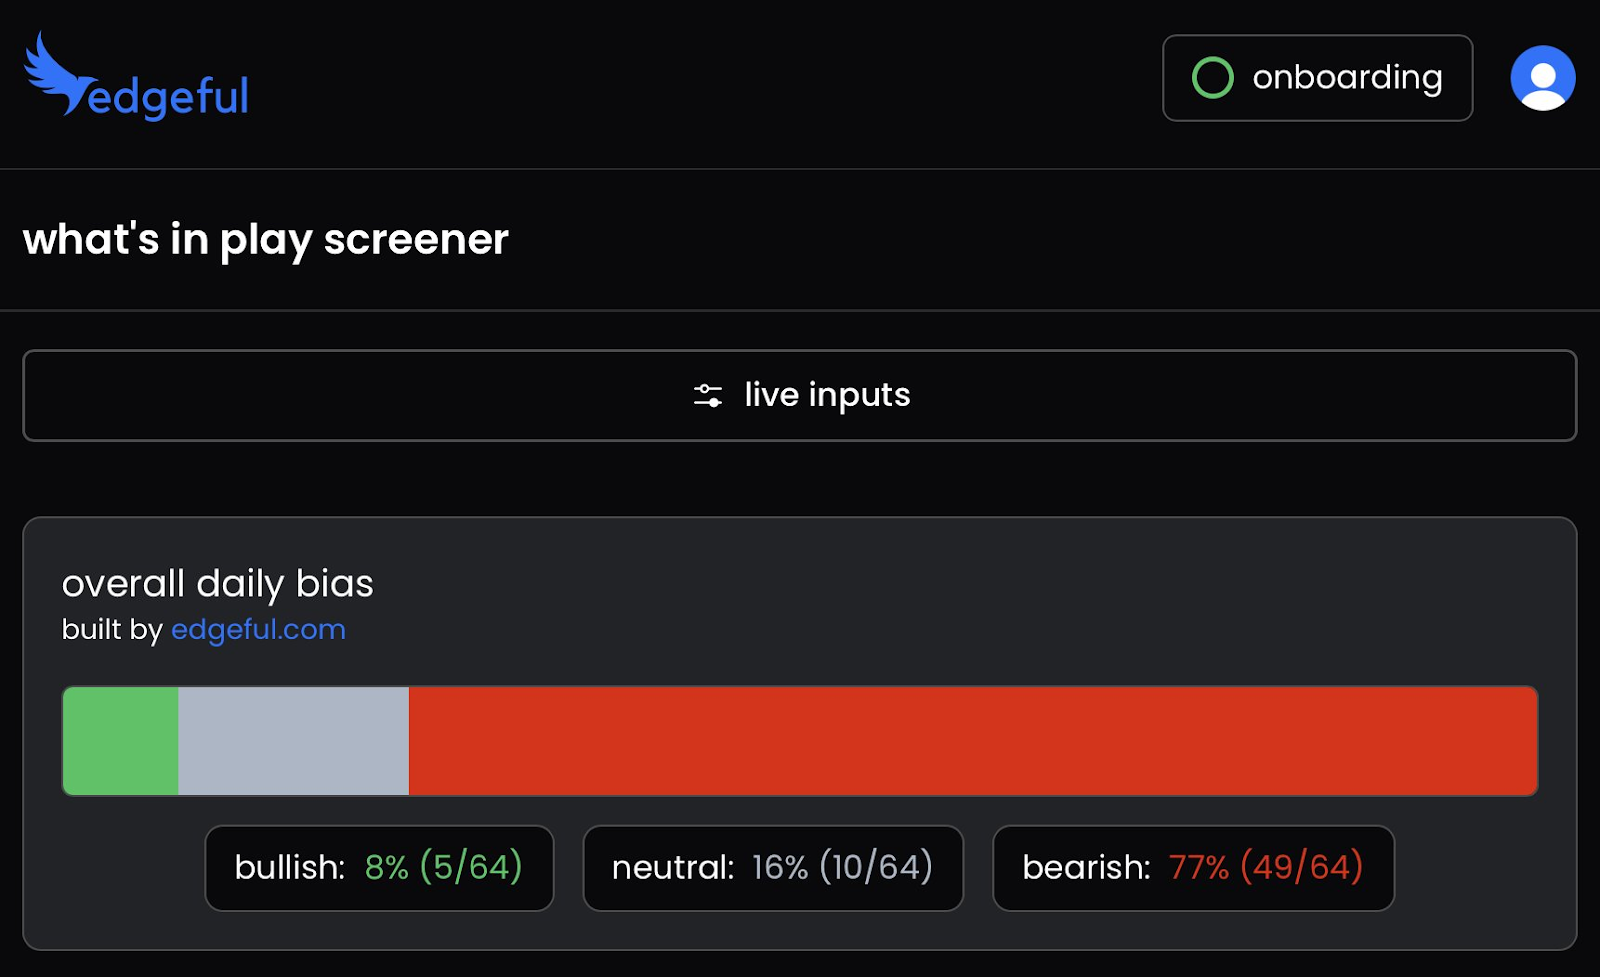
What the data says:
- Most tracked symbols/strategies are red.
How to trade it:
- Hunt shorts
- Skip dip-buying unless your plan explicitly supports it
- Don’t try to catch falling knives
- Translation: let the downside do the work. You’re following, not fighting.
3) Neutral / Choppy (mixed signals)
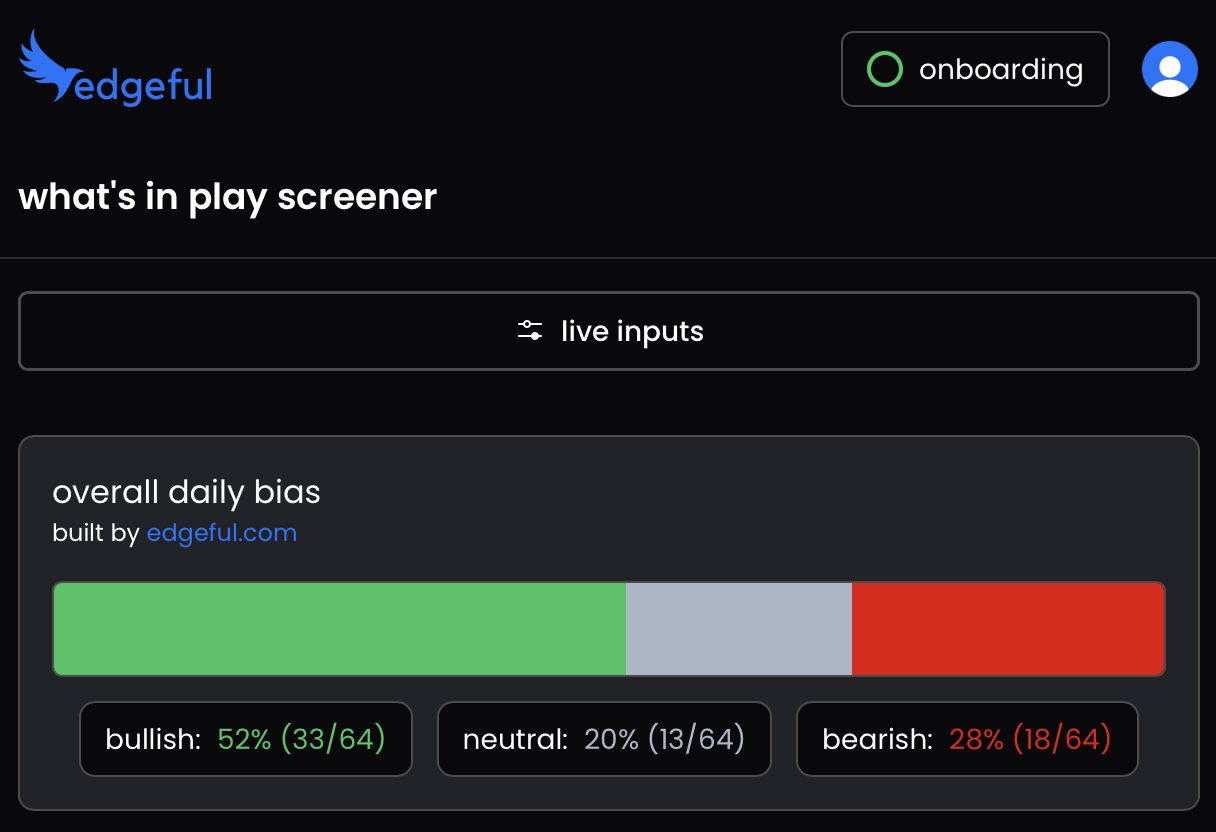
What the data says:
- Roughly half green, half red, or lots of “neutral.” That’s indecision.
How to trade it:
- Reduce size
- Take profits quicker
- Or stand down and protect mental capital
- Translation: mixed inputs → mixed outcomes → trade smaller or not at all.
The data that powers it
There are two important inputs to choose from:
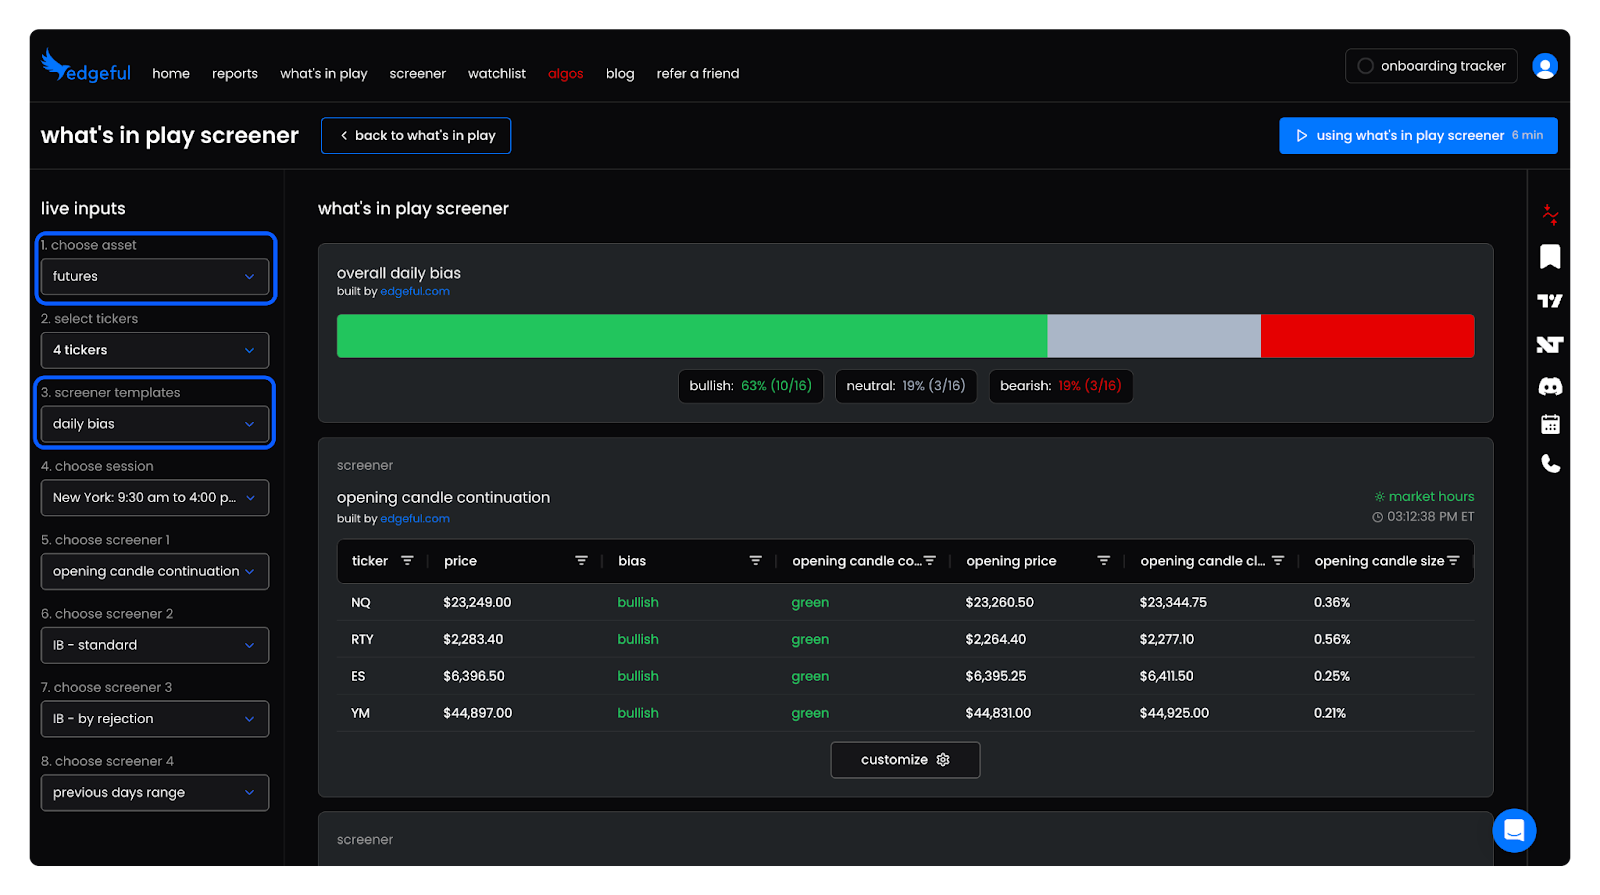
Input #1: Asset Type
- stocks
- futures
- all
I usually have “all” selected — and it’ll make sense as to why once I cover the next input of importance:
Input #2: Screener Templates
- morning trader
- daily bias
- end of day
- custom
I highly recommend using the “daily bias” template here, which then checks the action across 4 different reports to make up the bias bar:
- opening candle continuation
- Initial Balance – standard
- IB – by rejection
- previous day’s range
When you have the asset type as “all” it will populate the bias bar using these actions across these tickers for the 4 reports listed above:
MAG 7 stocks:
- AAPL, MSFT, GOOGL, AMZN, NVDA, TSLA, META
Major indices:
- SPY, QQQ, ES, NQ, YM, RTY
All using live data that updates throughout the session.
Your morning routine (5 steps)
- Open your sentiment dashboard
- Check the overall daily bias bar first
- 65%+ green? build a long-only plan for your names
- 65%+ red? build a short-only plan (or bias to short setups)
- Mixed? trim size, tighten targets, or sit out
Let the bias bar fuel your plan. If you’re long on a red day or short on a green day, you’re choosing to fight the numbers.
Why this matters for day traders
It keeps you out of the three biggest traps:
- Fighting trend days
No more shorting a tape that’s clearly green, or buying every dip on an obvious red session. - Getting chopped up
Mixed inputs = early warning for chop. You’ll know to size down or avoid the grind. - Emotional trading
Bias is objective, not a feeling. Your plan aligns with the majority, not with your anxiety.
After a few sessions, this becomes muscle memory. You’ll stop guessing and start aligning.
Getting started
The overall daily bias bar:
- Aggregates signals across your selected tickers + strategies
- Lives at the top of your screener
- Outputs bullish / bearish / choppy
- Uses live, validated strategy data
It’s part of the 2025 platform updates focused on instant bias and cleaner daily planning.
FAQ
What is sentiment analysis trading?
A systematic way to set directional bias using multiple assets + proven setups. It aggregates green/red signals into a simple read: with the tape or against it.
How “accurate” is it?
It doesn’t predict. It reflects what leaders are actually doing now (mag 7, indices, futures) and helps you align. It’s about probabilities, not prophecy.
Can beginners use it?
Yes. It’s perfect for new traders because it reduces guesswork: green → lean long, red → lean short, mixed → risk down.
Difference vs. technical analysis?
Technical analysis = one chart at a time.
Sentiment analysis = many charts + multiple strategies summarized into one bias.
How often should I check it?
Once each morning. The bias frames your session. you can recheck after big news, but the morning read sets the plan.
What about mixed signals?
Mixed is valuable: it tells you to slow down. smaller size, faster profits, or no trade. Knowing when not to trade is the edge.
Does it work in all conditions?
It works best in trending markets and helps you avoid low-probability chop by flagging mixed inputs.
Can I pair it with other strategies?
Absolutely. let sentiment set direction, then run your usual entry/exit playbook within that bias.
Quick Recap
Sentiment analysis trading helps you:
- replace emotional bias with objective data
- pool signals from proven intraday strategies
- watch major market movers in real time
- get clear daily guidance: bullish / bearish / choppy
The key is consistency. Check the bias bar every morning, align your plan, and stop fighting obvious trend days. On green days, look for longs. On red days, look for shorts. On mixed days, protect capital.
trade with the market — not against it.