5 Swing Trading Strategies (Backtested + Trading Rules)
Today, we provide you 5 swing trading strategies with backtest and trading rules
Swing trading is a trading style focused on profiting from short- to medium-term price swings in stocks, ETFs, or other assets. Swing trading work involves capturing these market swings or price swings—short- to medium-term market fluctuations—within larger market trends, typically by holding positions for several days or weeks. This trading work operates at a slower pace than day trading, allowing traders to capitalize on short-term movements without the rapid shifts of more volatile markets. Swing trading occupies a middle ground between day trading and long term investing: unlike day trading, you don’t close all trades by the end of each trading day, and unlike long term investors, you aren’t holding for years to benefit from broader market trends. Instead, swing traders look for bigger moves and hold their positions for longer periods than day traders, but for shorter periods than long-term investors—usually a short period of days or weeks.
Swing trading, day trading, and long-term investing
Key differences between swing trading, day trading, and long term investing include trading frequency, time frame, and risk exposure. Swing trading is less time-consuming than day trading, making it suitable for those with other commitments or individuals with limited time, as it does not require constant monitoring. However, it demands more time investment than long-term investing, as traders must monitor their positions regularly. Swing trading is popular due to its high degree of flexibility, allowing positions to remain open as long as profit prospects remain. Trading frequency in swing trading is higher than in long-term investing but lower than in day trading, and higher frequency can lead to increased transaction costs, which are a key factor influencing profitability and risk management.
Swing trading positions are subject to overnight and weekend market risk, which can lead to potential losses. Swing traders hold positions for several days or weeks, seeking to capture a portion of an existing trend rather than long-term growth. Swing trading strategies can enhance a longer-term investment strategy by capturing frequent short-term price movements and can be applied across various markets, including stocks, ETFs, and forex. Many swing traders focus on technical analysis, market cycles, and reversal points to identify entry and exit points, and they often set well-defined profit targets and stop-loss orders to manage risk effectively. Swing trading requires a well-defined risk management strategy to protect against potential losses, including strict risk management by setting stop-loss orders to cap losses, typically targeting a maximum loss of 3% to 4%, and aiming for a risk-reward ratio of at least 1:2 or a favorable 3-to-1 risk-reward ratio. Automated stop-loss orders should be set below support for long trades or above resistance for short trades.
Swing trading is not as narrowly focused as day trading, but it also differs from long-term position trading, which is driven more by fundamentals and involves holding positions for weeks or months at a time. Swing trading is a form of trading work that operates by capturing short-term market fluctuations or ‘swings’ over several days. Successful swing trading strategies use a combination of technical analysis techniques, such as trend pullbacks, support and resistance, breakouts, Fibonacci retracements, and chart patterns. Swing trading pros include capturing short-term market swings and requiring less time than day trading.
Technical Indicators and Trend Alignment
Swing traders often seek out volatile stocks for better trading opportunities due to their predictable price swings. They rely heavily on technical analysis to make informed trading decisions, focusing on historical price patterns and current price action to establish entry and exit points. Commonly used technical indicators in swing trading include the Relative Strength Index (RSI), moving averages, and stochastic oscillators. The stochastic oscillator is a momentum indicator that helps swing traders identify potential price reversals and momentum shifts, while the RSI helps identify whether an asset is overbought or oversold. Moving averages are used to visualize the average value of an asset over a set timeframe and can indicate potential price direction changes; the exponential moving average gives higher weight to recent price data to better detect short-term trends. Moving average crossovers, when a shorter-term moving average crosses above a longer-term moving average, can signal an upward trend.
Trend alignment requires checking higher timeframes, such as weekly charts, to ensure trading in the direction of the broader trend. Fibonacci retracement is used to predict potential reversal levels during pullbacks in price trends. Price action is used in technical analysis to identify market cycles, support and resistance levels, and turning points in swing trading. The time frame is important in swing trading, as trades are typically held for a short period, such as days or weeks. Swing traders often use daily and weekly charts to identify entry and exit points and use technical analysis to identify entry points (identify entry) and exit points.
The Role of Volume and Momentum in Trend Confirmation
Support and resistance trading involves identifying key levels where a stock has historically reversed and trading in relation to these levels. Breakout trading involves entering a position when a stock price breaks above a resistance level or below a support level, typically confirmed by high volume. Pullback trading involves waiting for a temporary dip during an uptrend before entering in the direction of the main trend. Breakout trading targets assets that show significant price consolidation, entering when prices break above resistance or below support levels. Price breaks are key moments when the price moves through established support or resistance levels with significant volume. Swing traders often look for chart patterns, such as the bull flag—a pattern that appears during a strong uptrend, characterized by a brief consolidation or correction phase—to identify entry and exit points. The trend’s momentum is assessed to determine entry and exit points, and the trading range is used in technical analysis, such as with the stochastic oscillator, to compare recent closing prices and identify momentum shifts, which can signal potential trend reversals or trading opportunities.
Swing traders may take a long position after a breakout or a short position during a downtrend or double top formation. High volume is a key indicator in breakout trading, confirming the strength of a price move. Average value is used in moving averages to summarize price movements over specific timeframes. While swing trading primarily relies on technical analysis for decision-making, fundamental analysis—including economic cycles and earnings—can also be used to provide broader context for trade opportunities.
Trading day flexibility allows trades to be closed within a trading day or held longer, depending on market conditions and profit potential. Swing trading strategies are designed to capture gains over a short period, such as days or weeks, and are considered successful swing trading strategies when they use a combination of technical analysis techniques, such as trend pullbacks, support and resistance, breakouts, Fibonacci retracements, and chart patterns.
The core idea is simple but people mess it up by being too aggressive or not having proper trading rules. You want to exploit the long-term rising trend of the stock market by buying when there is short-term weakness or panic. You buy the weakness and you sell when the market shows strength. This is called mean reversion.
5 swing trading strategies
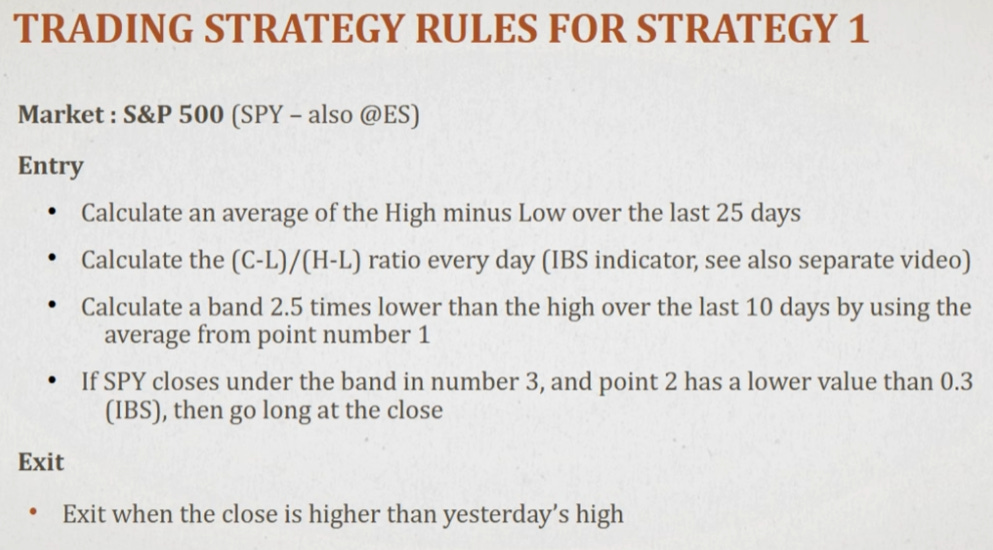
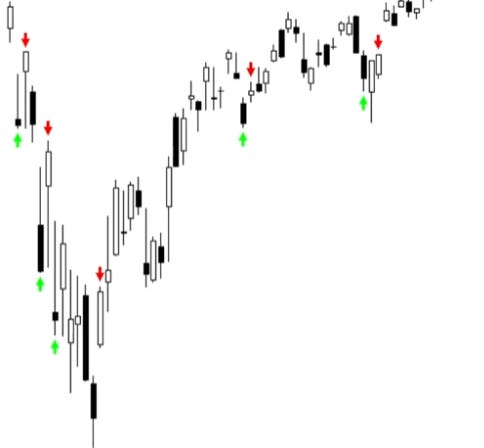
This first strategy is about identifying when the price has dropped significantly from a recent high. You need to do some math for this one:
5 swing trading strategies for beginners trading rules
First, calculate the average of the High minus the Low over the last 25 days. This gives you the average daily range. Then you calculate a band that is 2.5 times lower than the high of the last 10 days using that 25-day average range.
It sounds complicated but it’s just measuring how far the price has stretched away from its recent peak.
You also need the IBS indicator: IBS is (Close – Low) / (High – Low). It tells you where the close is relative to the day’s range. If SPY closes under that band you calculated and the IBS is lower than 0.3, you go long at the close.
The exit is simple. You sell when the close is higher than yesterday’s high. You are selling into strength.
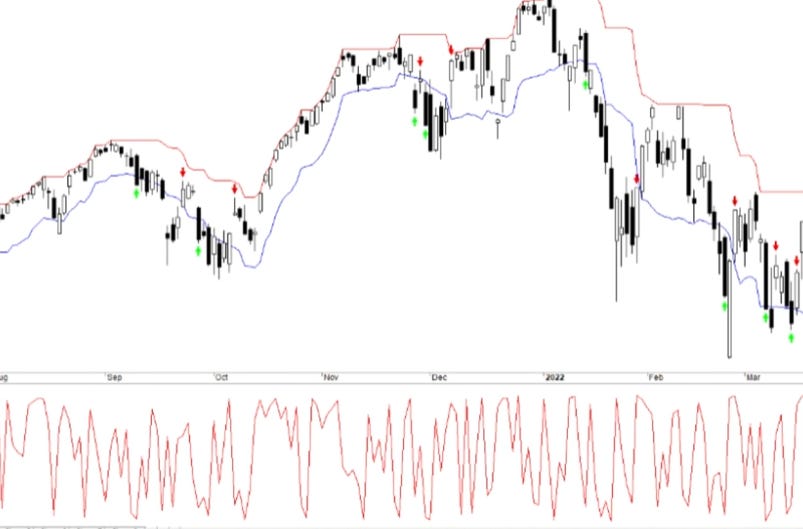
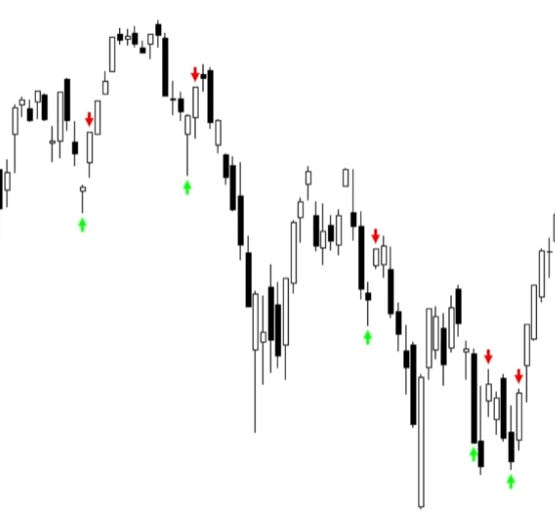
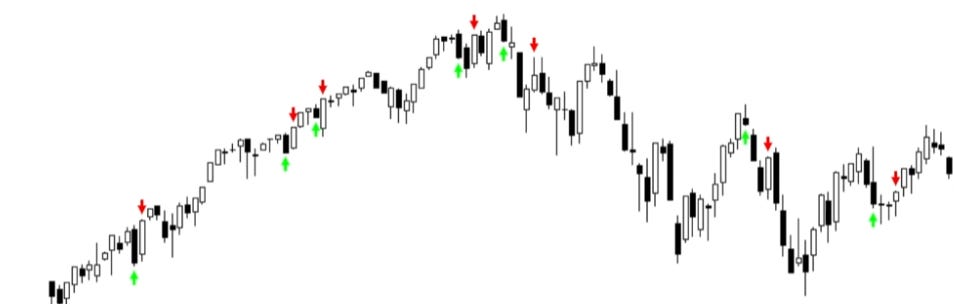
The green and red arrows show you where you buy and sell:
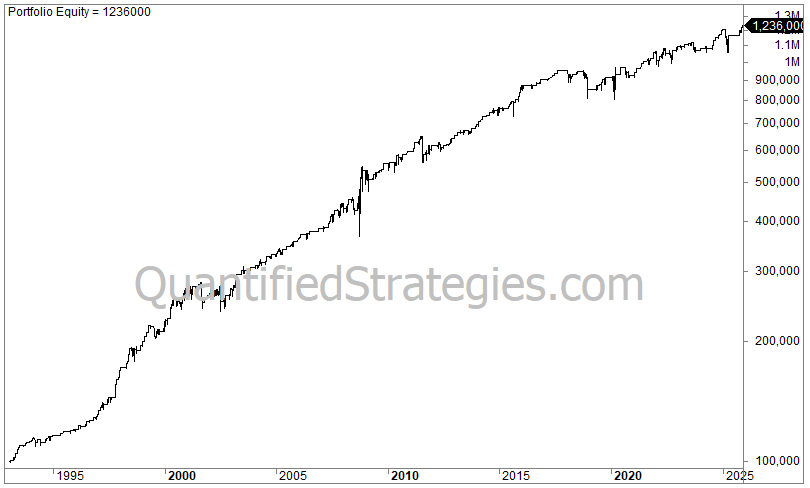
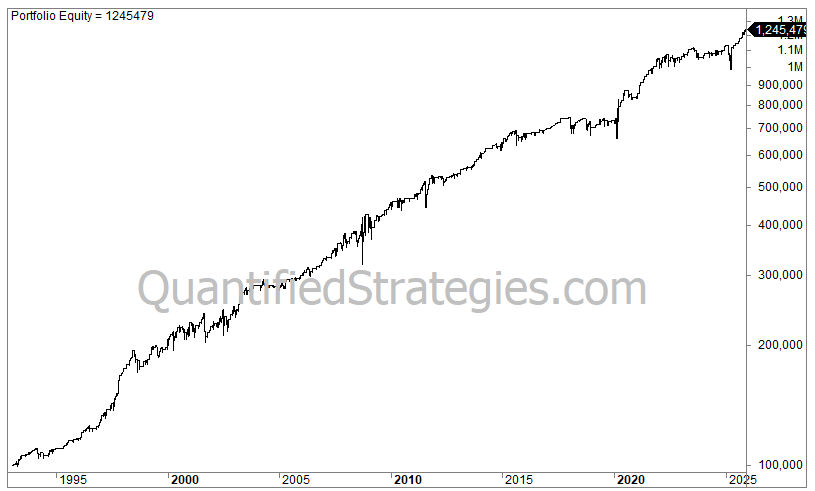
Looking at the numbers from 1993 to 2025, a $100,000 starting capital grew to 1.2 million dollars:
5 swing trading strategies for beginners backtest
That’s an 8% annual return. Now, that is slightly lower than just buying and holding the S&P 500, but here is why it matters: you are only in the market 18% of the time. If you aren’t in the market, you aren’t exposed to the big crashes.
The max drawdown for this strategy was 23%, while buy-and-hold investors had to sit through a 55% drop. When you divide that 8% return by the 18% time spent in the market, the risk-adjusted return is 44%. You get most of the gains with a fraction of the ulcer-inducing drops.
This one is a classic. It’s often called Turnaround Tuesday because the market has a habit of rallying on Tuesdays after a crappy Monday.
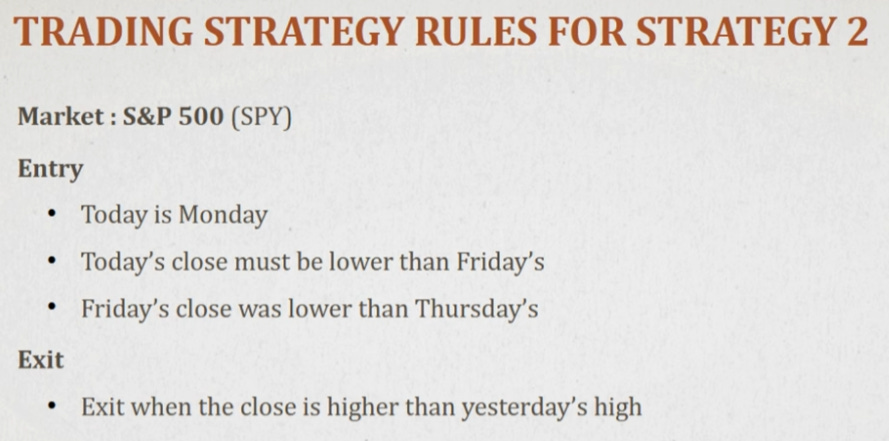
The rules are very specific. You buy at the close on Monday, but only if two things are true: today’s close is lower than Friday’s close, and Friday’s close was lower than Thursday’s close. Basically, the market has to be down two days in a row ending on a Monday. If that happens, you go long at the Monday close.
You exit when the close is higher than yesterday’s high.
It’s a pure play on short-term panic. People get scared over the weekend, they sell on Monday, and then the professional buyers step back in on Tuesday.
It doesn’t work every single time because losing trades are part of the process, but the equity curve since 1993 shows it’s a consistent way to grab small gains.
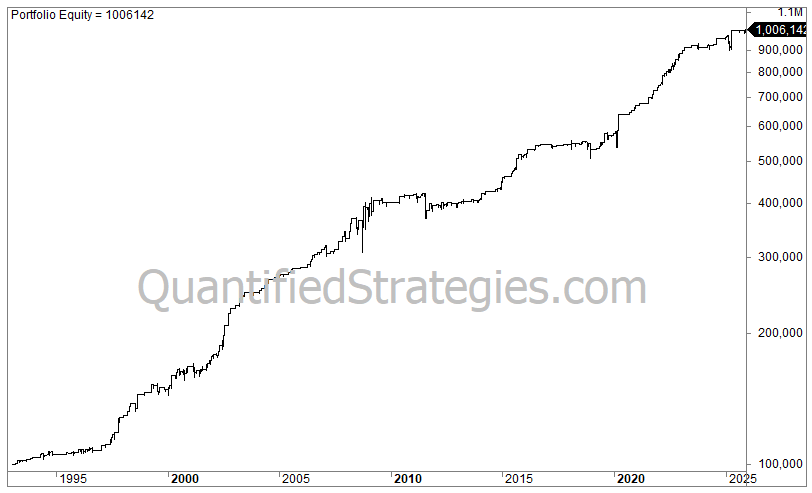
5 swing trading strategies for beginners results
A 100,000 investment would have compounded annually at 7.2% from 1993 until today. The equity curve rises steadily, and the equity would have grown to one million by today. Not too bad for such a simple strategy. There are 271 trades that, on average, are invested just 4 days, thus making you invested just 11% of the time and hence avoiding the worst drawdowns. Max drawdown is at only 16%. Again, the risk adjusted return is very high at 65%.
If you want something even simpler, look at Strategy 3.
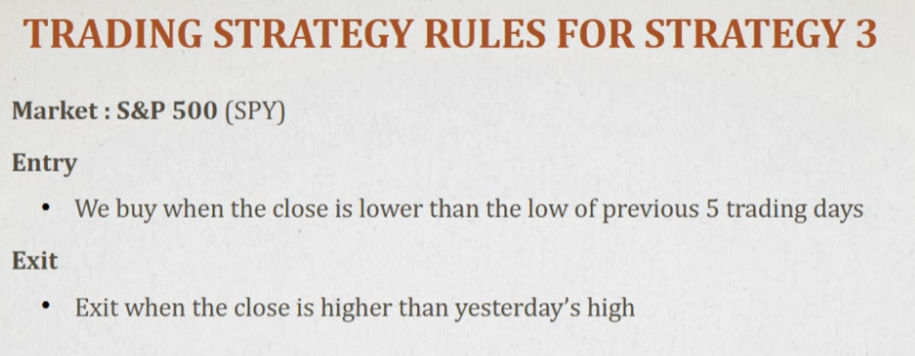
You buy when the close is lower than the low of the previous five trading days. That’s it for the entry. You are looking for a week’s worth of downward pressure. When the market breaks below a five-day low, it’s often overextended to the downside.
The exit rule stays the same as the others: exit when the close is higher than yesterday’s high. This is the theme of these strategies. You buy when people are selling and you sell the second the market shows a sign of life. You don’t wait for a huge rally. You just want that one “swing” back to the mean.
5 swing trading strategies for beginners performance
If we look at the equity curve of the strategy, it’s hard not to be impressed of such a simple strategy. You started with 100,000 in 1993 and end up with 1.25 million today, despite being invested just 21% of the time. The annual returns are 8%, while the risk-adjusted return is 37%. Again, it shows that simplicity works in the stock market. As a matter of fact, simplicity trumps complexity.
This strategy uses the ADX indicator and the daily range. ADX measures the strength of a trend.
For this strategy, you want the 5-day ADX to be above 40. That means there is a very strong trend happening. At the same time, you want today’s range, the High minus the Low, to be the lowest range of the last 6 days. This is a “volatility squeeze.”
The market is in a strong trend but the price movement has suddenly tightened up. It’s like a spring being coiled. You buy that tight range and, again, you sell when the close ends higher than yesterday’s high. You are betting that the trend will resume or snap back after that brief period of quiet.
Let’s look at how your equity would have grown if you traded all signals from 1993 until today.
Swing strategies for beginners
We start with 100,000 USD in 1993 and let it compound until today. As you can see, the equity shows an upward slope. There are a few setbacks along the way, but overall, the strategy performs reasonably well. The statistics are not as good as the previous three strategies, but the strategy complements the other strategies well.
This last strategy is a bit counter-intuitive. Usually, people see a new high and they want to buy because they think the market is “breaking out.”
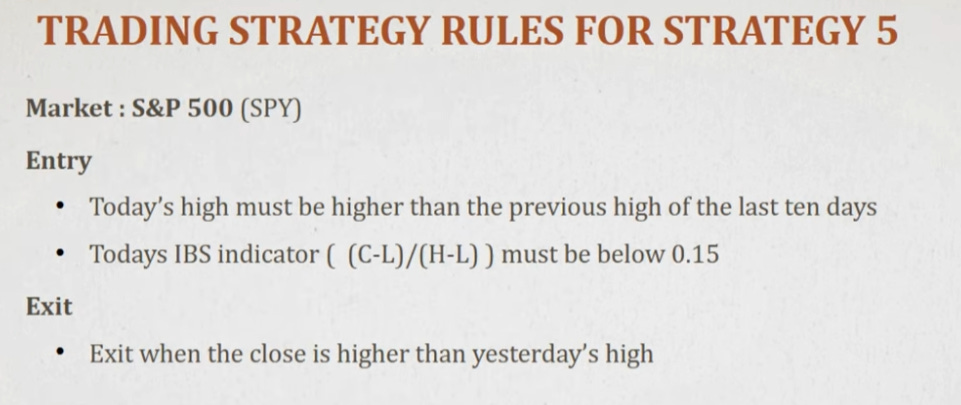
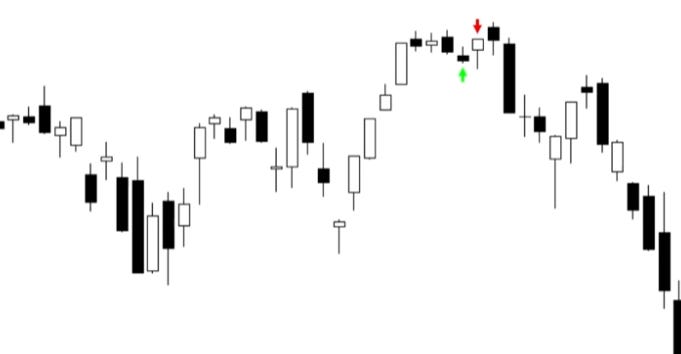
This strategy does the opposite. You look for a day where today’s high is higher than the previous high of the last ten days. So, it’s making a 10-day high.
But, you only buy if the IBS indicator is below 0.15. Remember, IBS is (Close – Low) / (High – Low). An IBS of 0.15 means that even though the market hit a new 10-day high at some point during the day, it closed in the bottom 15% of its daily range. It’s a “failed” breakout. The market tried to go higher and got rejected.
Why buy that? Because in a long-term bull market, these intraday rejections are often just temporary noise.
Swing strategies for beginners, mean reversion
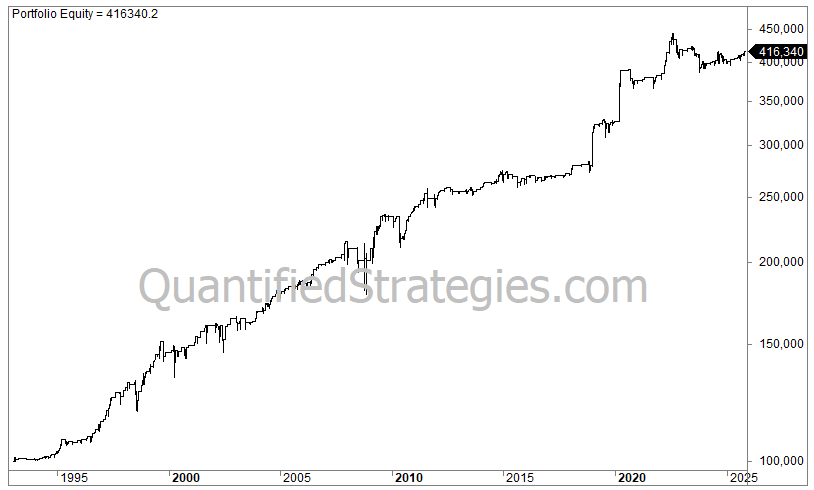
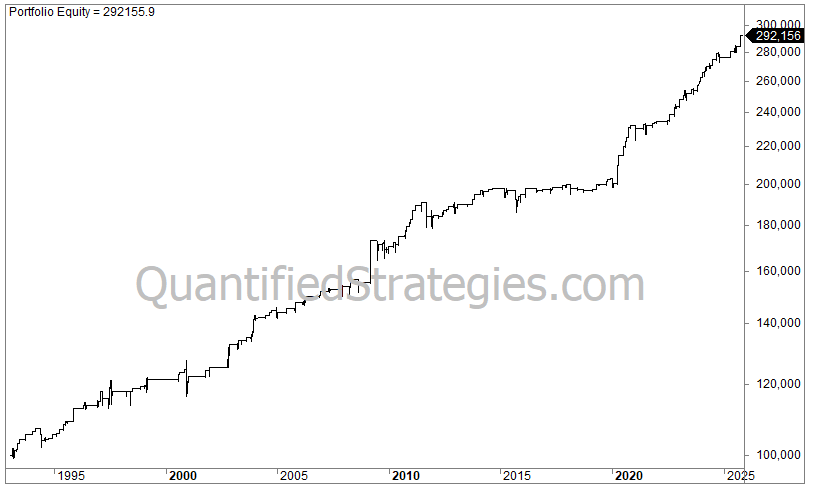
From 1993 to today, a $100,000 investment in this would have grown to about $300,000. The annual return is 7.2%, but you are only invested 11% of the time.
You only took 271 trades over those decades. The average trade only lasts 4 days. Because you are out of the market 89% of the time, your max drawdown is only 16%. Your risk-adjusted return here is 65%. This is how you stay in the game for thirty years without blowing up your account.
We’ve now presented five free swing trading strategies for beginners. To wrap things up, let’s run a final combined backtest.
In this test, we trade all strategies simultaneously, but allocate 100% of the equity to a single position at any given time. That means we ignore new buy signals if a position is already open. Since all five strategies use the same exit rule, there are no conflicts when it comes to selling.
When we combine all five strategies, the result is a significantly higher number of trades.
5 Swing trading strategies for beginners
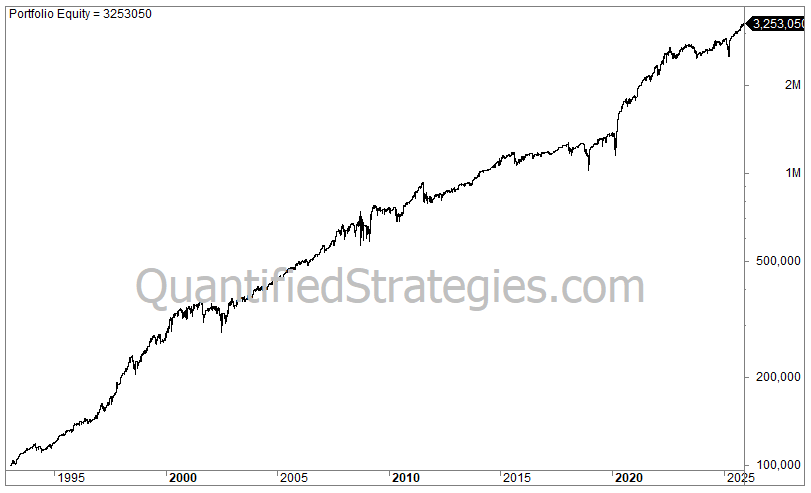
An initial investment of 100,000 in 1993 would have grown to 3.2 million, with a maximum drawdown of just 23%. That’s the power of compounding – it snowballs over time. Keep in mind that the scale on the right is logarithmic, not linear, so what you’re seeing reflects relative changes.
Let’s summarize the combined results. Across 975 trades, the average return per trade was 0.38%, leading to a compounded annual return of 11.1%. That’s better than buy-and-hold, despite being invested only 41% of the time.
When combining all five strategies, there were only two losing years: 2008 and 2018, down 1% and 13% respectively.
And yes, it feels great to make money when the market is falling. Even though all these strategies trade only from the long side, bear markets can still be favorable. Increased volatility often improves short-term long setups, not just short strategies.
One major thing people ignore is slippage and commissions. In these backtests, we include 0.03% per trade for those costs. If you use a broker with high fees or you trade stocks with no liquidity, those small costs will eat your 7% or 8% annual return for breakfast.
You also have to follow the exit rules. Beginners often see a trade go in their favor and they get greedy. They think, “Maybe it’ll go higher tomorrow.” No. The rule is you exit when the close is higher than yesterday’s high. If you don’t sell on that strength, you are no longer swing trading; you are just gambling on hope.
Common mistakes include:
- Over-leveraging: Thinking that because the drawdown is low (like 16% in Strategy 5), you can trade five times your account size. Don’t.
- Ignoring the Trend: These strategies work because we are exploiting the long-term rising trend of the S&P 500. If the entire global economy is in a structural collapse, these mean reversion plays will be much riskier.
- Failing to Backtest: Don’t just take a strategy from a PDF and throw your life savings at it. You need to understand that the “Turnaround Tuesday” logic works on the SPY, but might not work on a random volatile penny stock.
The reason these strategies matter is that they give you a mathematical edge. You aren’t guessing. You are looking for specific conditions, like a Monday close being lower than a Friday close, and acting on them.
It is boring. It is repetitive. But that is what professional trading looks like. You spend most of your time waiting for the market to panic, you jump in for 4 days, and you get out when things look good again. It keeps your stress low and your drawdowns manageable compared to the 55% drops that regular investors have to endure. Stay grounded in the numbers and don’t try to be a hero. Just follow the rules.
However, this is not investment advice. Please do your own backtesting and due diligence!
That was all for today, and we hope the 5 swing trading strategies for beginners give you some food for thought.
Risk Management for Swing Traders
Risk management is the backbone of successful swing trading. While swing traders focus on capturing medium term price movements—often holding positions for just a few days or weeks—protecting your capital is just as important as finding the next winning trade. Without a solid risk management plan, even the best swing trading strategies can quickly unravel.
One of the most effective ways swing traders manage risk is by setting clear entry and exit points before placing a trade. This means using technical analysis to identify where you’ll get in and, just as importantly, where you’ll get out—whether the trade goes your way or not. Tools like the Relative Strength Index (RSI) help traders spot overbought or oversold conditions, signaling when a price swing might be due for a reversal. Moving averages are another staple, helping swing traders confirm the trend direction and spot potential support and resistance levels on the price chart.
Chart patterns also play a big role in risk management. Recognizing formations like bull flags, double bottoms, or head and shoulders can give traders an edge in predicting upward and downward trends, allowing for more precise entry and exit points. By combining these technical indicators, swing traders can set stop-loss orders just below support or above resistance, limiting potential losses if the market moves against them.
Ultimately, the key to risk management in swing trading is discipline. Sticking to your trading plan, respecting your stop-loss levels, and not letting emotions dictate your decisions will help you survive the inevitable losing streaks and keep your account growing over the long run. Remember, successful swing traders rely on a repeatable process—one that balances the pursuit of gains with the protection of capital.