

The Eighth Wonder of Trading: Compounding Returns

Today, we look at what the eighth wonder of trading is – compounding returns (the eighth wonder presumably said by Albert Einstein).
Most traders focus on entries, exits, win rates, and indicators. But sometimes the biggest difference in long-term returns comes from something much simpler: how small details move the needle.
Take the same trading strategy, but make a small change to increase the annual return 0.3%. The difference can be surprisingly large.
That difference is the power of compounding (and time).
What Is Compounding?
Compounding is often described as one of the most powerful forces in finance, but its impact is not always obvious when looking at individual trades.
A single profitable trade may look almost identical whether you use a fixed amount of capital or reinvest accumulated profits. The real difference appears over time.
Compounding is not so easy to see because it requires time to show. However, when it kicks in, your capital grows exponentially.
Compounding Strategy
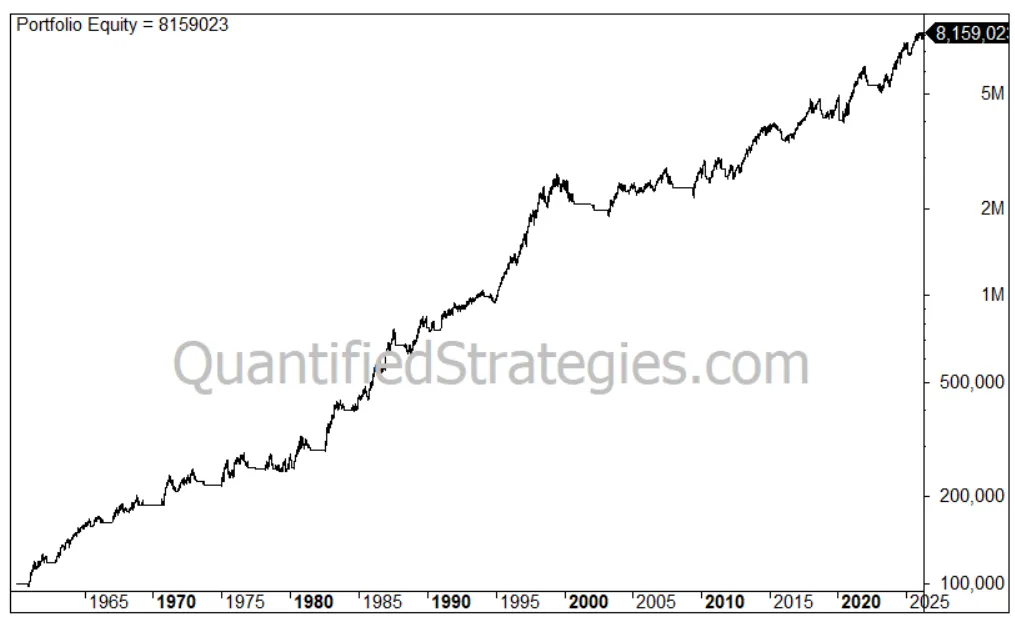
We run the good old 200-day moving average crossover system for the S&P 500 from 1960 to today.
When we use a simple moving average, the CAGR is 6.86%:
If we switch to an exponential average (EMA), the average increases to 7.17% per year:
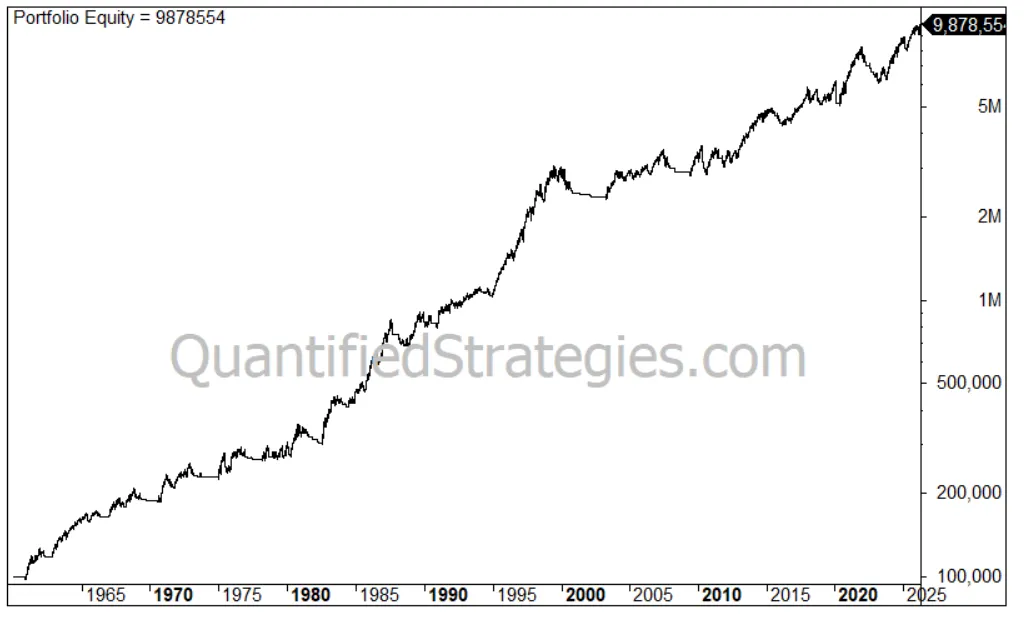
However, over such long periods, even “small” improvements can drastically change the end result: your capital increases from 8.16 million to 9.88 million.
Takeaway
In compounding, returns are the engine, but time is the fuel:
Without returns, nothing compounds. But without time, compounding never has a chance to show its true power.
Returns start the compounding process. Time does the heavy lifting.
But many fail to reach any compounding potential, because the process gets “interrupted”. Many are looking for 15-20%+ strategies, which are almost impossible to achieve over many years without huge setbacks, but all they need to do is find solid 10% strategies and ensure they don’t disrupt the compounding process.
Slow and steady is the way to go.