
Bullish Harami: A Small Candle With Big Reversal Potential – Backtest And Trading Rules

Today, we look at the Bullish Harami – a small candle with big reversal potential.
The bullish harami is one of those quieter signals: a two-candle pattern that suggests selling pressure may be weakening and buyers could be preparing to step in.
Does it work? We quantify and backtest it.
Key Takeaways
- Bullish Harami signals potential short-term reversal
- Two-candle pattern shows selling pressure weakening
- Entry requires RSI below fifty filter
- Mean-reversion filter improves signal reliability
- Fixed holding period tested across days
- Moderate win rate with positive expectancy
- Works best in short-term rebound setups
- Drawdowns higher than typical trend systems
What Is A Bullish Harami?
One pattern that often appears near the end of a short-term decline is the bullish harami.
It is a two-candle formation where a large bearish candle is followed by a smaller candle contained within the body of the previous one. Visually, it looks like the market suddenly pauses after a selloff.
Here’s an example:
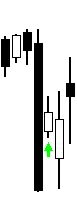
The theory goes like this:
The bullish harami suggests that sellers, who were previously in control, may be losing strength. Buyers have not yet taken over, but the aggressive downside momentum has slowed.
For traders, this can be an early clue that a reversal, bounce, or consolidation phase may be near.
That’s the theory. Of course, almost no one has backtested the candlestick patterns, but we have. On our website, you can find all 75 candlesticks quantified and backtested with trading rules and code. You find it in our shop.
Bullish Harami Trading Strategy
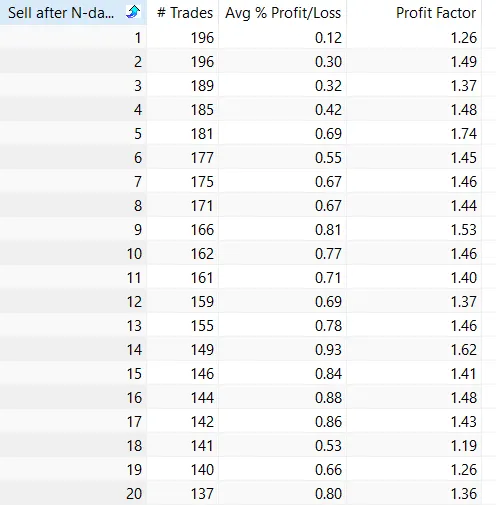
First, we backtested each Bullish Harami signal for the S&P 500 and held the position for 1-20 days.
However, we have a filter in place (see trading rules below).
These are the results:
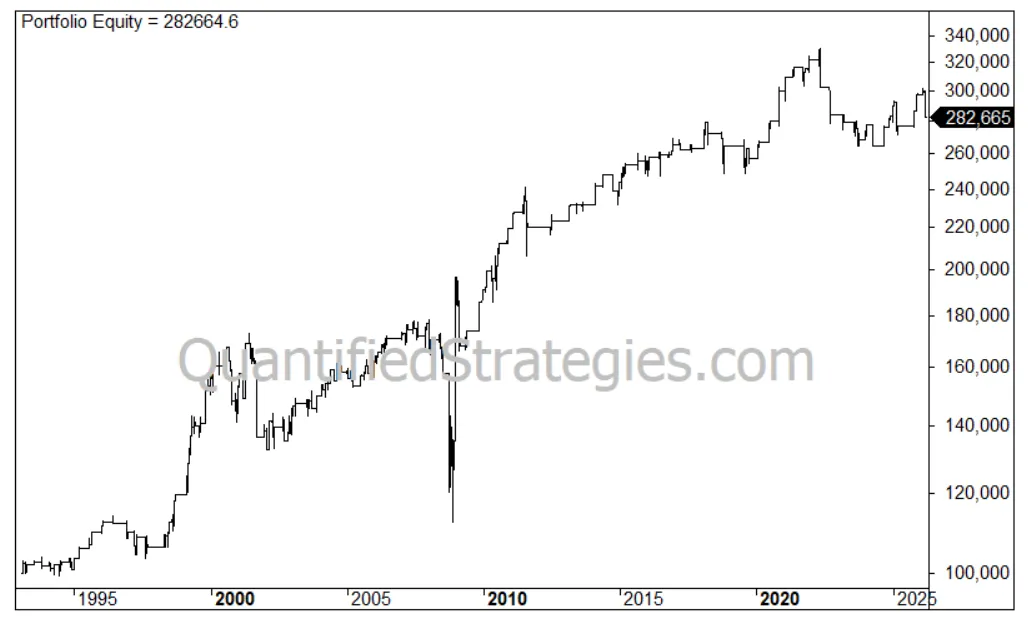
If you hold for ten days, you get the following equity curve:
Performance
- No. of trades: 162
- Average gain per trade: 0.77%
- Win ratio: 64%
- Profit factor: 1.5
- Annual returns (CAGR): 3.2%
- Exposure/time in the market: 19%
- Risk-adjusted return: 16% (CAGR divided by time spent in the market (0.19))
- Max drawdown: 36% (buy and hold 55%)
Trading Rules
We made the following trading rules:
You find the trading rules at the bottom of the article
We use RSI as a filter because we know the stock market’s mean-reversion tendencies. You don’t want to buy when the market is overbought.