
Trend-Following Strategy With A VIX Twist (14% Risk-Adjusted Return)

Today, we are looking at a strategy that we call trend following strategy with a VIX twist.
We found this in Alpha Architect’s database. However, we made a twist to it.
Can VIX (implied volatility) be used to improve a trend-following strategy? The logic is that we can incorporate the VIX and, hopefully, improve the signal’s power.
Trend-Following Strategy With A VIX Twist
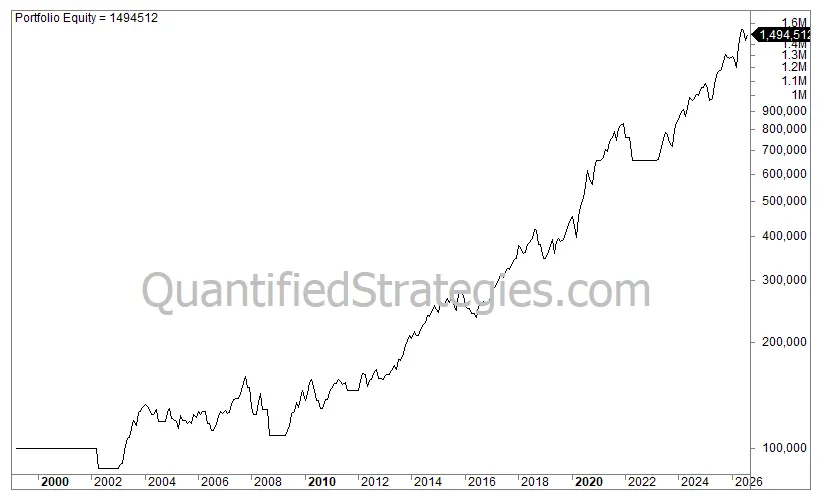
We backtested the strategy only on Nasdaq-100 (QQQ), and we got the following results (monthly bars):
Strategy type: Trend-Following.
Market: Nasdaq 100 (QQQ).
Performance
- No. of trades: 19
- Average gain per trade: 20.5%
- Win ratio: 63%
- Profit factor: 4
- Annual returns (CAGR): 10.4%
- Exposure/time in the market: 74%
- Risk-adjusted return: 14% (CAGR divided by time spent in the market (0.74))
- Max drawdown: 31%
Trading Rules
We used the following trading rules:
🔒 These trading rules are for members only.