7 Best Algo Trading Strategies for Beginners
This article presents the 7 best algo trading strategies for beginners. This is meant as a jump-start for anyone looking to move away from subjective opinions and toward data-driven trading.
Before diving in, it’s important to understand the key concepts of algorithmic trading, as a solid foundation will help you make the most of these strategies.
Most trading advice online is impossible to backtest, leading to struggles for those just starting out. By relying on statistics rather than stories, you can judge a strategy’s effectiveness based on historical performance and clear entry and exit rules. However, a basic understanding of market dynamics and trading logic is essential before attempting to automate your strategies.
To learn algorithmic trading, you should focus on acquiring knowledge in quantitative analysis and trading logic, as these are crucial for building effective strategies. Many beginners fail in algorithmic trading because they lack a basic understanding of market dynamics. Additionally, algorithmic trading relies heavily on quantitative analysis or quantitative modeling.
Related reading: Algorithmic trading -The COMPLETE guide
What is Algorithmic Trading?
Algorithmic trading, often called algo trading, is the process of using computer programs to automatically execute trades in financial markets. Instead of relying on gut feelings or manual decisions, algorithmic trading uses trading algorithms—sets of predefined rules based on timing, price, quantity, or complex mathematical models—to make trading decisions. These computer programs can execute trades at speeds and volumes that are impossible for a human trader to match, allowing for greater efficiency and precision.
One of the main advantages of algorithmic trading is its ability to minimize the impact of human emotions, such as fear or greed, which often lead to poor trading decisions. By sticking to a set of rules, trading algorithms can help traders avoid costly mistakes and stick to their strategy, even during periods of market volatility. Additionally, algo trading can help reduce transaction costs by optimizing trade execution and taking advantage of fleeting opportunities in the market.
As financial markets have become more complex and competitive, algorithmic trading has become increasingly popular among both individual traders and large institutions. By leveraging sophisticated strategies and advanced technology, algorithmic traders aim to improve their trading performance and gain an edge in today’s fast-moving markets.
1. The 200-Day Moving Average
The 200-day moving average is a cornerstone of algorithmic trading, famously used by investor Paul Tudor Jones to stay out of trouble during major bear markets. This is a classic example of a simple moving average crossover strategy, where traders compare short-term and long-term moving averages to identify potential buy or sell signals.
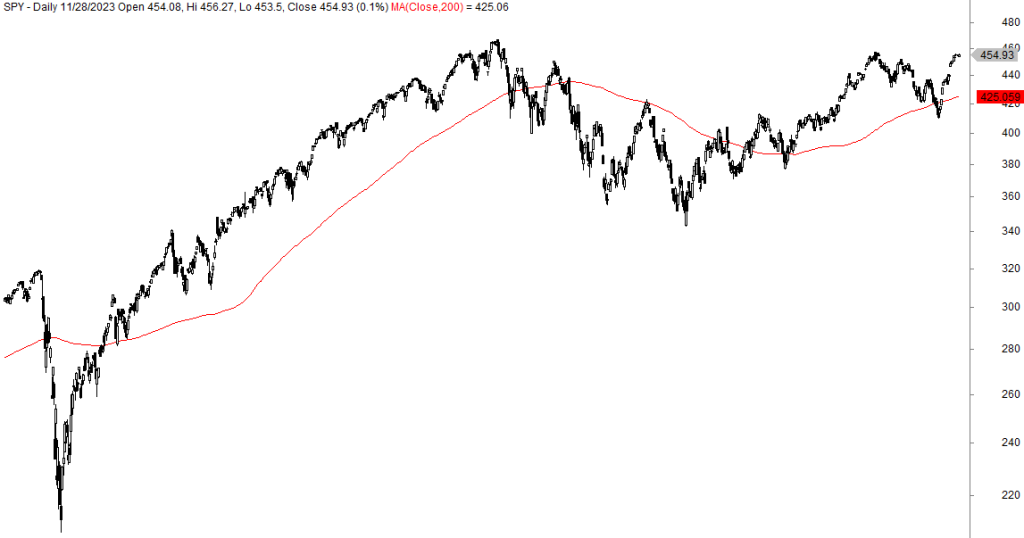
The strategy is simple:
- Buy when the S&P 500 is above its 200-day moving average.
- Sell when it drops below.
Since 1960, this approach has returned 6.6% annually, almost as good as buy-and-hold’s 7.1%, with a maximum drawdown of only 28%, compared to the 56% drawdown of a buy-and-hold strategy.
You are invested about 70% of the time, and thus can earn interest on your deposit when you are out of the market.
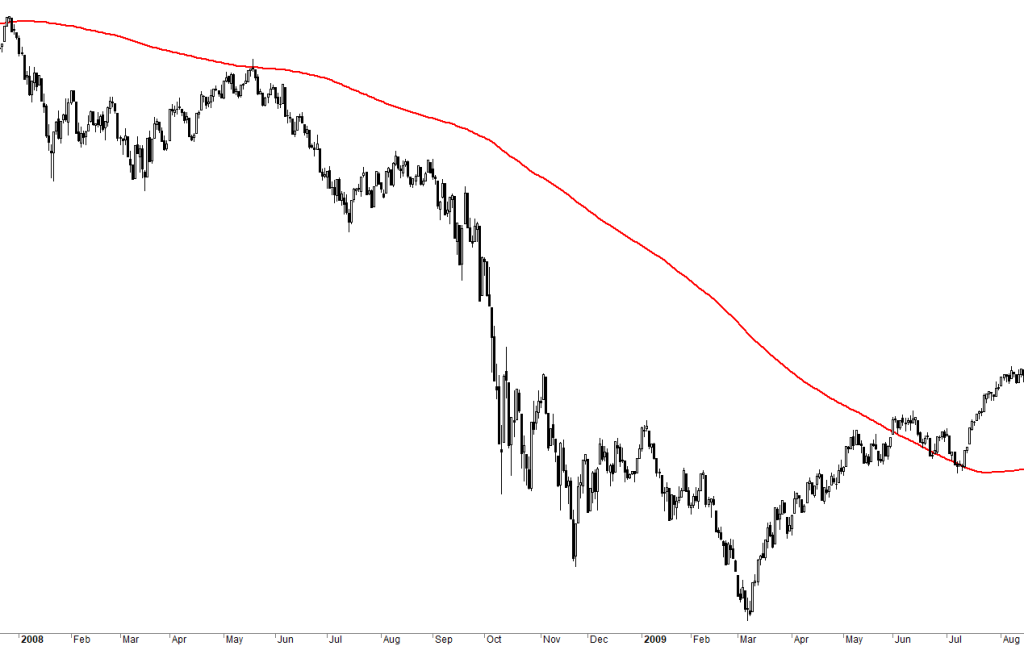
Take a look at 2008. This strategy had you exit the market before the financial crisis and reenter in 2009. You avoided a 55% crash. This is why Paul Tudor Jones loves the 200 day moving average.
Once the dust settles, you’re compounding from a much higher base.
The 200-day moving average also works great as a filter for short-term strategies. Let’s show you by using a mean reversion strategy where the 200-day moving average acts as a regime filter.
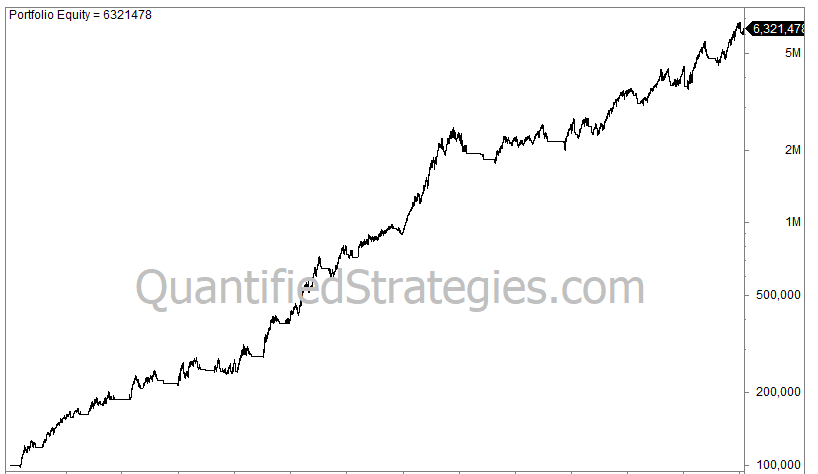
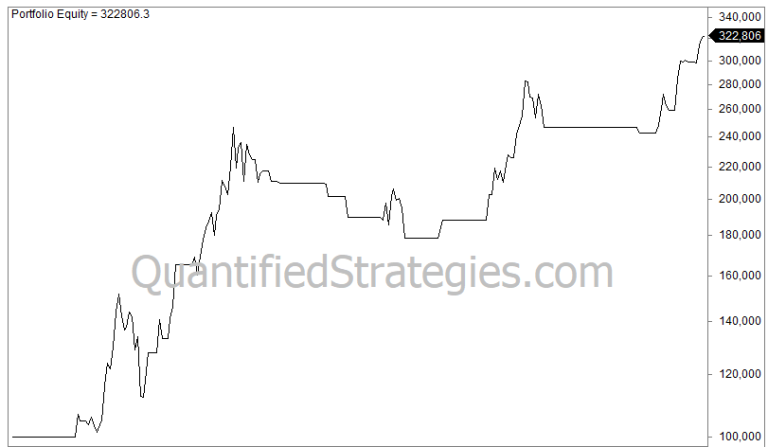
First, we backtest without any filters. We buy when the five-day RSI dips below 35 and sell when it goes above 50.
While the equity curve looks decent, the drawdown reaches 31%—something that would make most traders quit.
But let’s add the 200-day filter: we only trade if the price is above it. If the price is above it’s a bull market and we can enter during a pullback. If the price is below the average, we stay out.
The result? A smoother equity curve because the average gain per trade increases while the drawdowns are significantly reduced: max drawdown is only 14% and they are quick to recover. That’s a psychological advantage, as most traders find losses more painful than they enjoy wins.
Backtesting is crucial for beginners to ensure an algorithm’s viability before trading with real money.
What happens if we flip the filter and only trade when below the 200-day average?
Performance becomes more erratic, and the drawdowns are bigger.
Let’s go the second algorithmic trading strategy for beginners: the Golden Cross.
2. The Golden Cross Trend Following
The Golden Cross occurs when a short-term trend (the 50-day moving average) crosses above a long-term trend (the 200-day moving average), signaling a bullish breakout. This is a classic example of a simple moving average crossover.
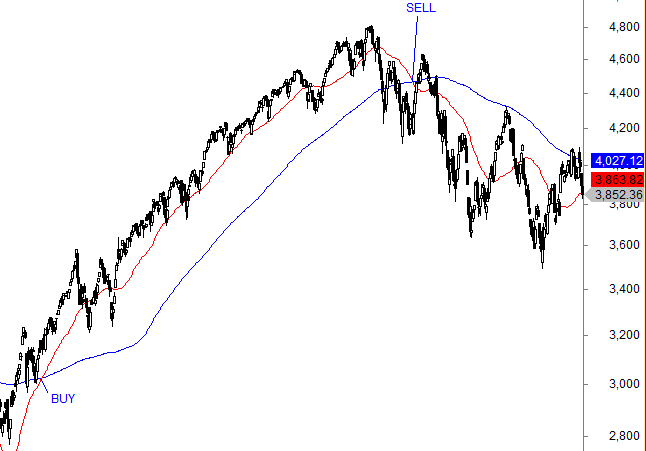
In the chart above, if you had bought in July 2020, the 50-day MA crossed above the 200-day MA. Buying here and holding until March 2022 would’ve netted a 32.4% gain.
So how does it perform long-term?
- Buy Trading Rules: When the 50-day MA crosses above the 200-day MA.
- Sell Trading Rules: When the 50-day MA crosses back below the 200-day MA (the “Death Cross”).
We backtested the strategy from 1960 on the S&P 500. It made just 33 trades, each held for roughly 400 trading days.
79% of the trades were winners. Average gain per trade was 15.7%. The annual return was 6.7%, slightly below buy-and-hold’s 7.1%—but remember, the strategy was only invested 70% of the time.
Max drawdown? 33%, compared to 56% for buy-and-hold. That gives a better risk-adjusted return: 9.6%.
The primary strategy aims of the Golden Cross are to capture major uptrends while managing downside risk. When implementing this strategy, it is important to understand your risk tolerance, as it will affect your comfort with potential drawdowns and returns. Implementing algorithmic trading strategies requires a clear, well-researched trading strategy that outlines your goals and risk tolerance.
Let’s go the third algorithmic strategy. This is slightly more complicated and has less data to back it up.
3. TQQQ and BTAL Annual Index Fund Rebalancing
For beginners seeking a “set and forget” approach, this strategy involves rebalancing two ETFs once a year in January: TQQQ (3x leveraged Nasdaq-100) and BTAL (an anti-beta ETF). Both TQQQ and BTAL can be used in index fund rebalancing strategies, where index funds periodically adjust their portfolios to match a benchmark index. This periodic rebalancing by index funds creates trading opportunities for algorithmic strategies that anticipate these scheduled adjustments.
TQQQ provides aggressive growth, while BTAL acts as a hedge, typically rising when high-beta stocks fall. This combination has yielded an 18% annual return since 2012.
Annual return was a solid 18%, max drawdown was a moderate 28%, and it beat Nasdaq in 8 out of the last 13 years. Index fund rebalancing strategies capitalize on the expected trades that occur when index funds adjust their portfolios to align with benchmark indices.
But be careful. TQQQ is leveraged and risky. It’s built for short-term trades, not long-term holds. And always factor in fees and taxes with leveraged ETFs.
Still, the combination of upside and protection makes this strategy hard to ignore.
Let’s go to the fourth strategy:
4. Gold Momentum Strategy
This momentum strategy uses a two-step verification process to trade gold (GLD) based on its relationship with Treasury yields (IEF). While many trading models are complex, the beauty of the Gold Momentum Strategy lies in its simplicity. Many beginners benefit from starting with simple strategies, which use straightforward trading rules and are easier to understand and implement. Complexity often increases the risk of overfitting, in which a strategy is too closely tailored to past data and fails in real time.
- The Signal: Go long on gold if the 12-month total returns for both gold and 10-year Treasuries are positive.
- The Exit: Move to cash if either asset shows a negative 12-month return.
Trend-following strategies are the most common algorithmic trading strategies and often rely on moving averages and related technical indicators.
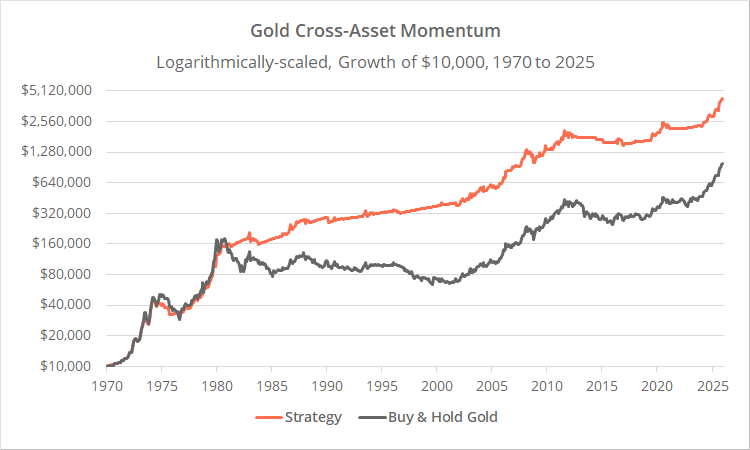
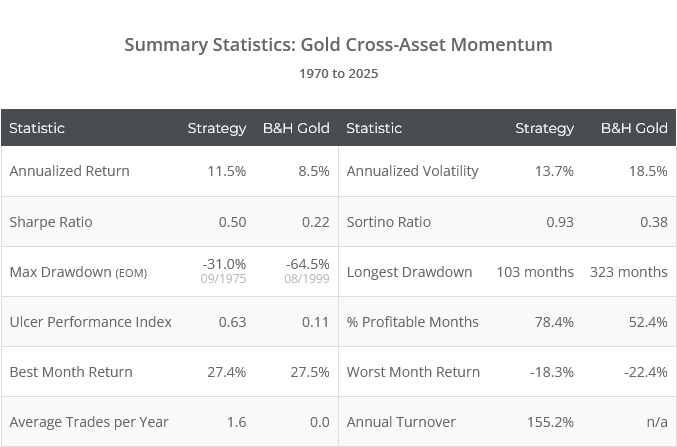
This strategy has consistently outperformed buy-and-hold gold over five decades with much smaller drawdowns. Annualized return was a respectable 11.5% while max drawdown was 31% compared to buy and hold’s 64%.
However, there are nuances to its performance:
Since roughly 2002, the advantage of the strategy versus a simple buy-and-hold approach has appeared to wane slightly. The equity curve on the screen shows the return of GLD from its inception until today, which is just above two decades. During this period gold has risen substantially, and the strategy has not managed to catch up.
Despite the lower cash returns, the strategy remains similarly effective when looking strictly at the periods when the investor is actually in the market.
5. RSI Mean Reversion (The “QS Exit”)
The Relative Strength Index (RSI) is a powerful tool for short-term trading and serves as a classic example of reversion strategies. These strategies capitalize on the tendency of asset prices to revert to their mean or average values. A highly effective version of this strategy uses a 2-day RSI:
- Buy: When the 2-day RSI crosses below 10.
- Sell: When the 2-day RSI crosses above 80.
Mean reversion strategies are based on the concept that asset prices tend to gravitate towards a long-term average.
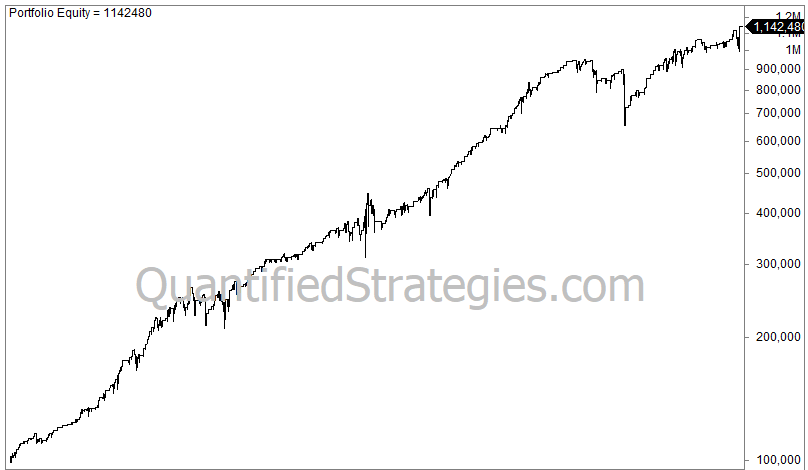
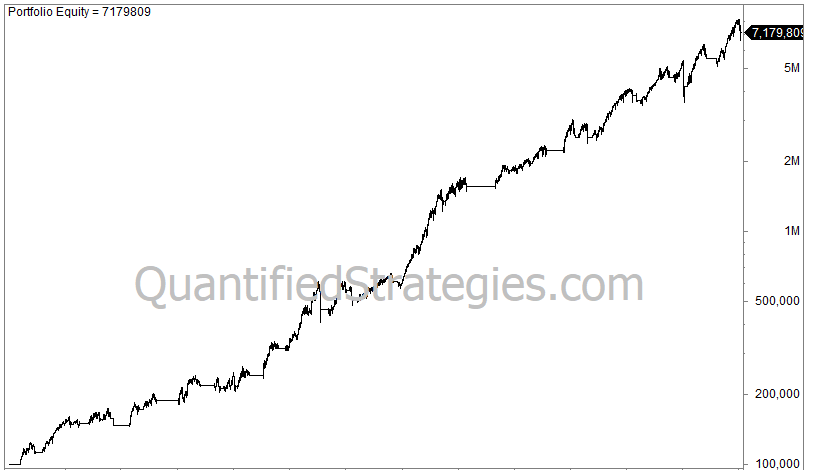
We backtest it on the S&P 500 by using the ETF with the ticker code SPY, and we enter and exit at the close.
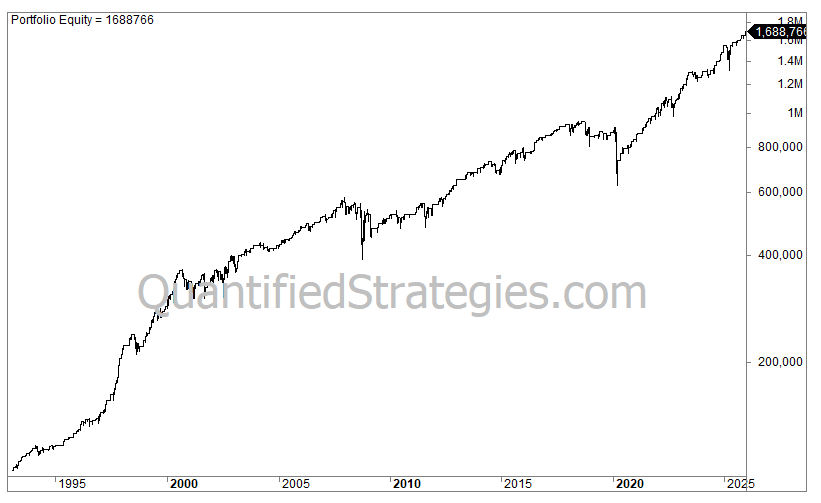
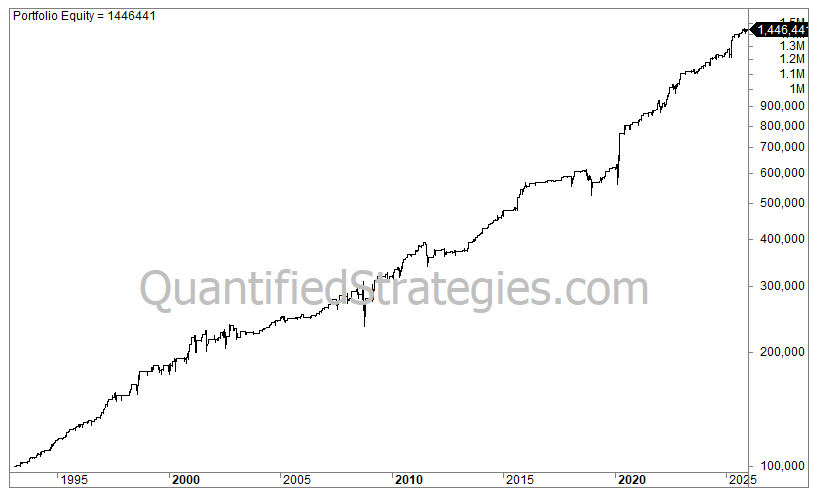
Our starting capital of 100,000 grows to 1.6 million after about 33 years at 9% annually. This is not too bad for being invested only 27% of the time!
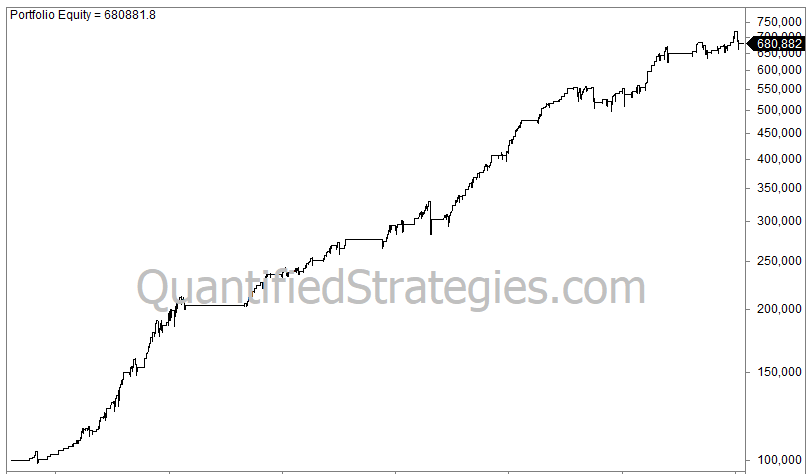
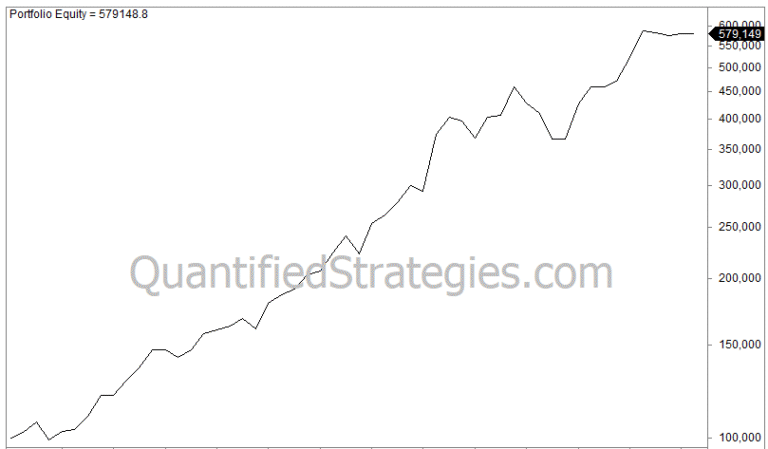
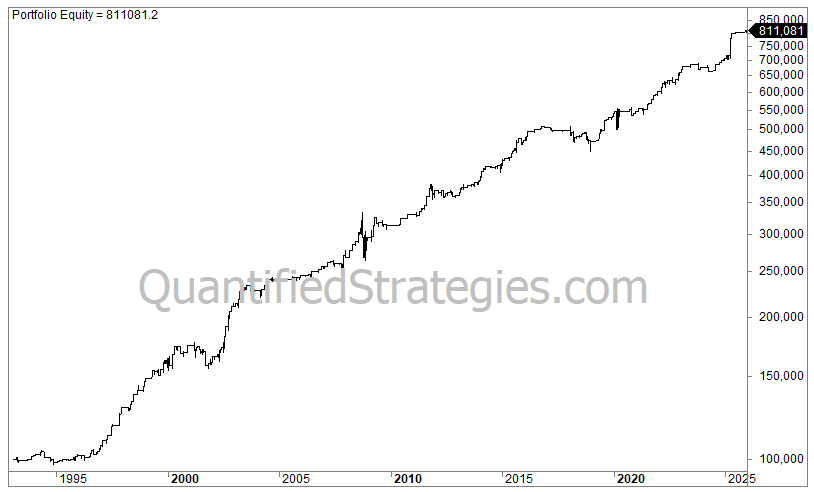
However, we can develop a second, improved strategy. Let’s change the sell criterion and sell when the close is higher than the highest price from yesterday:
- Buy: When the 2-day RSI crosses below 10.
- Sell: When the close is higher than yesterday’s high (known as the QS Exit).
This improved exit provides a smoother equity curve and a better “recovery factor” than standard RSI exits.
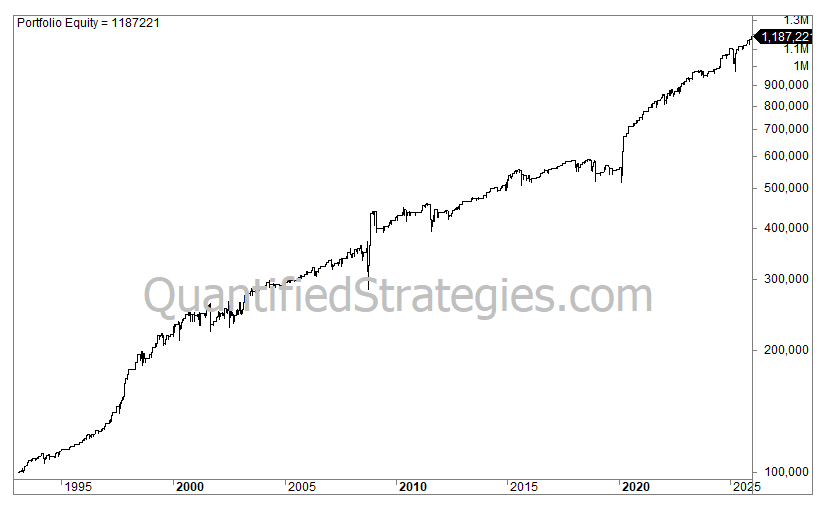
The starting capital of a hundred thousand grows to 1.2 million – a bit short compared to the first strategy -, but you experience a smoother ride with smaller losses.
We argue that the second strategy is better.
Why?
Because the max loss from a peak in the equity comes in at 23%, but is rarely worse than 12% and lasts for a short time. You suffer less when using the second strategy.
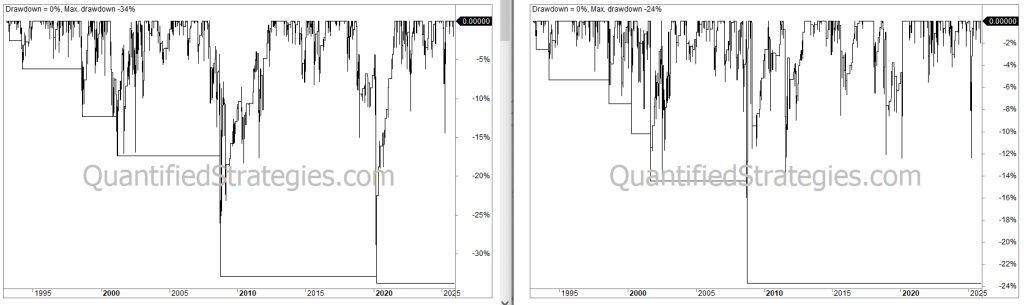
The drawdowns in the first strategy is on the left side, and the second strategy is on the right side. On the right side the losses are both smaller and shorter resulting in a better recovery factor, exactly what you are looking for in a trading strategy.
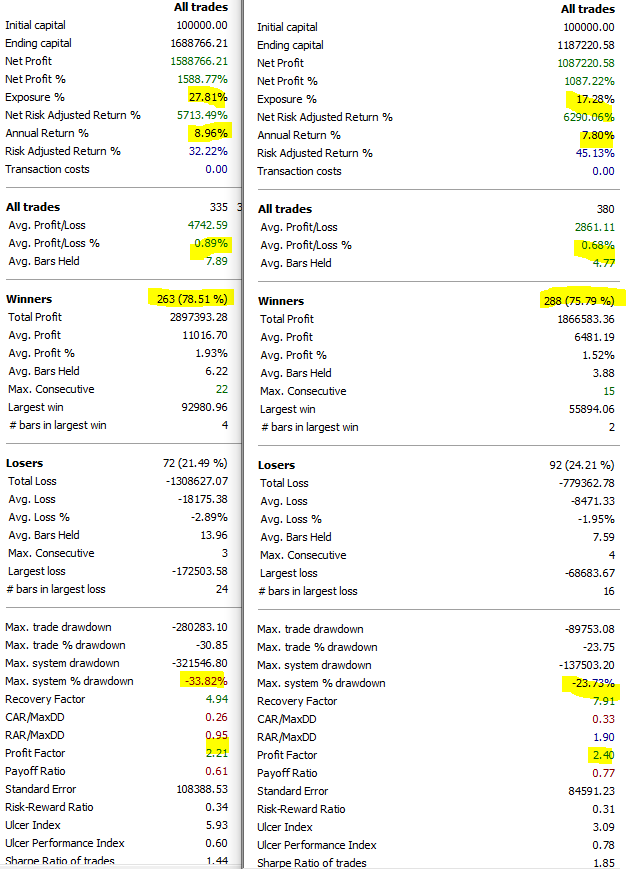
The second strategy spends 10% less time in the market and hence get a better risk-adjusted return. The performance metrics for the first strategy is on the left and the second is on the right side.
Regular monitoring of performance metrics and system health is essential in algorithmic trading to ensure proper execution.
We are traders, and we would prefer to trade the strategy with the best statistics and metrics, and that’s strategy 2 on the right side.
Let’s go to our sixth algorithmic trading strategy for beginners. This time, we are using a trend filter called the Choppiness Index.
6. Choppiness Index Filter
Created by Bill Dreiss, the Choppiness Index helps traders avoid “choppy” sideways markets and focus on trending ones.
- Setup: The 15-day Choppiness Index must be below 50 (indicating a potential trend).
- Entry: Enter long when the 2-day RSI falls below 20.
- Sell: When today’s close ends above yesterday’s high.
By avoiding ranging markets, this strategy yields a high risk-adjusted return while being invested only 15% of the time.
The backtest reveals an average return of 0.69% per trade, with the strategy invested only 15% of the time, yielding 8.5% annually.
The performance yields a risk-adjusted return of 52% and a max drawdown of 23%.
We have covered six algorithmic trading strategies; now, let’s look at the seventh and the last. This is a seasonal algorithmic strategy that only trades at a certain day of the week, namely Mondays. The strategy is called Turnaround Tuesday.
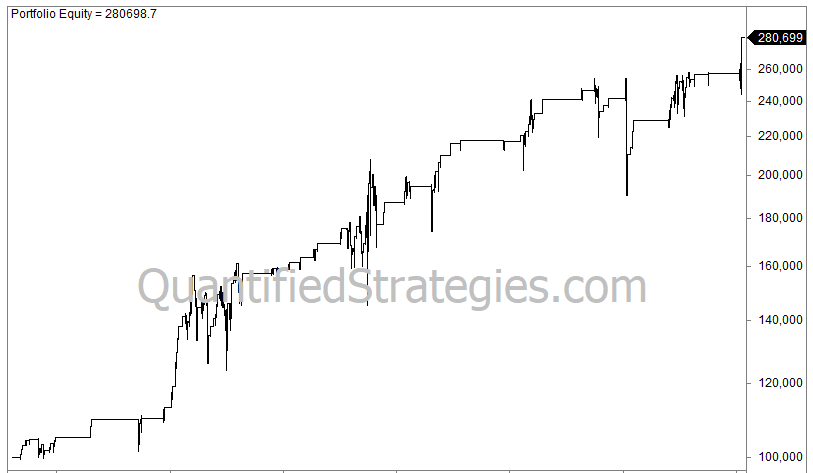
7. Turnaround Tuesday
This seasonal strategy exploits a specific weekly pattern in the S&P 500 where markets often rebound on Tuesdays after a weak Monday.
- Buy: On Monday if the close is lower than Friday’s low.
- Sell: When the close is higher than the previous day’s high or after four days.
This very simple strategy has performed well. One hundred thousand invested in 1993 is worth eight hundred thousand today. The 0.6% gain per trade compounded at 6.5% annually, while being invested only 11% of the time. Max drawdown was 20%.
These results show that various market participants, including beginners, retail investors, and institutions, can utilize this strategy to compete efficiently in the market. For beginners, it is advisable to paper trade this strategy before committing real money. Paper trading allows you to test the algorithm in a simulated environment with real-time market data, helping to identify issues and refine performance.
We believe these are very good metrics for such a simple idea.
By the way, we first presented this strategy 12 years ago on our website. We have hundreds of both free and paid strategies.
By implementing these 7 best algo trading strategies for beginners, you can build a more disciplined and statistically sound approach to the markets.
Building an Algorithmic Trading System
Building an algorithmic trading system is a structured process that combines creativity, technical skills, and disciplined risk management. The journey begins with strategy development, where you define the rules your trading system will follow. These rules can be based on technical analysis, quantitative models, or even machine learning algorithms. Some of the most common trading strategies in algorithmic trading include trend following, mean reversion, and arbitrage—each designed to capitalize on different types of market movements.
Once you have a clear strategy, the next step is to translate it into code using a programming language such as Python, C++, or Java. This allows your trading system to process real-time market data and execute trades automatically, without human intervention. Before risking real capital, it’s essential to backtest your strategy using historical data. Backtesting helps you evaluate how your trading system would have performed in the past, identify potential weaknesses, and fine-tune your parameters for better results.
After thorough testing, your algorithmic trading system can be deployed in live markets, where it will execute trades based on your predefined rules. However, even the best trading algorithms require proper risk management to protect against unexpected losses. Setting clear risk parameters—such as stop-loss levels or position sizing—helps ensure your trading account can withstand periods of market volatility.
Incorporating machine learning and advanced data analysis can further enhance your strategy development, allowing your trading system to adapt to changing market conditions and improve its chances of making profitable trades. By following a disciplined process and leveraging historical data, you can build an algorithmic trading system that is robust, efficient, and well-suited to today’s financial markets.