Modified Moving Average (MMA) – Strategy, Rules, Settings, Returns
There are several ways to smooth price data using the moving average technique, and one of the interesting averaging methods is the Modified Moving Average (MMA). What do you know about this MMA indicator?
Also known as the Running Moving Average (RMA) or Smoothed Moving Average (SMMA), the Modified Moving Average (MMA) is a type of moving average indicator that can be used to smooth the price data. It is partly calculated as the simple moving average (SMA) and the exponential moving average (EMA), but it offers a better smoothing effect than each of them.
In this post, we will take a look at most of the questions you may have about the modified moving average indicator: what it is, how it works, and how you can use it to improve your trading strategies. Let’s dive in!
Key takeaways
- The Modified Moving Average (MMA) updates its value by adding the current price to the running sum, subtracting the previous MMA value, and dividing by the number of periods.
- The first MMA value is calculated like a Simple Moving Average (SMA), but its formula is structurally similar to an Exponential Moving Average (EMA).
- MMA uses the reciprocal of the number of periods (1/N) as its smoothing constant, while EMA uses (2/N+1) as its multiplier.
- The MMA provides better smoothing than both SMA and EMA.
- A 14-period MMA is equivalent to a 28-period EMA, making it a smoother alternative.
- We show you a backtested Modified Moving Average trading strategy complete with trading rules and settings.
- Please click here for a stock technical indicators list.
What is the Modified Moving Average (MMA)?
Also known as the Running Moving Average (RMA) or Smoothed Moving Average (SMMA), the Modified Moving Average (MMA) is a type of moving average indicator that can be used to smooth the price data. It is partly calculated as the simple moving average (SMA) and the exponential moving average (EMA), but it offers a better smoothing effect than both of them.
The first value of the MMA is calculated exactly as an SMA, but all subsequent values are calculated by adding the current price data to a running sum and then subtracting the previous MMA value before dividing by the number of periods. Formula-wise, the MMA and EMA have a similar formula, but the former uses the reciprocal of the number of periods (1/N) as its smoothing constant (weighting multiplier ‘K’), whereas the latter uses the (2/N+1) factor.
In fact, the MMA is equivalent to an EMA of a higher period. For example, a 14-period MMA is equivalent to a 28-period EMA. Both indicators can be used to smooth the price data to identify the trend direction — when sloping upward, the trend is bullish and when sloping downward, the trend is bearish. They can also serve as dynamic support levels in an uptrend and resistance levels in a downtrend.
How does the Modified Moving Average differ from other moving averages?
The Modified Moving Average differs from other moving averages in that it measures its value for the current period by adding the current price data to the running sum and then subtracting the previous MMA value before dividing the difference by the number of periods.
The first value of the MMA is calculated exactly as an SMA, but formula-wise, it is similar to the EMA. While the MMA uses the reciprocal of the number of periods (1/N) as its smoothing constant (K), the EMA uses the (2/N+1) factor as its weighted multiplier.
Although the indicator is partly similar to the SMA and partly similar to the EMA, it offers a better smoothing effect than either of them. As a matter of fact, the MMA is equivalent to an EMA of a higher period — for example, a 14-period MMA is equivalent to a 28-period EMA.
Below is an example of how the modified MA compares to the two other most typical MAs:

Modified Moving Average trading strategy – rules, settings, returns, and performance
Let’s backtest a trading strategy that uses the Modified Moving Average – complete with trading rules and settings.
We make the following trading rules:
THIS SECTION IS FOR MEMBERS ONLY. _________________ BECOME A MEBER TO GET ACCESS TO TRADING RULES IN ALL ARTICLES CLICK HERE TO SEE ALL 400 ARTICLES WITH BACKTESTS & TRADING RULES
Commissions and slippage of 0.03% per trade are included.
This is a mean reversion strategy, and that type of strategy works best for stocks. Thus, we backtest the S&P 500 (SPY) from its inception in 1993 until today. This is the equity curve:
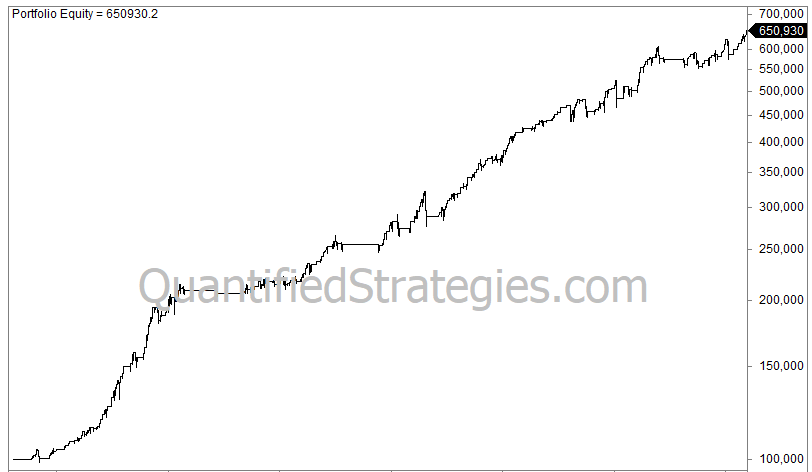
There were 390 trades, and the average gain per trade was 0.5% after commissions and slippage of 0.03% per trade (0.06% for a round-trip). Annual returns were 5.8%, but this has to be measured against being invested only 17% of the time. Max drawdown was a modest 14%.
This is the code for Amibroker:
THIS SECTION IS FOR MEMBERS ONLY. _________________ BECOME A MEBER TO GET ACCESS TO TRADING RULES IN ALL ARTICLES
CLICK HERE TO SEE ALL 400 ARTICLES WITH BACKTESTS & TRADING RULES
Why is the Modified Moving Average useful in trading?
The Modified Moving Average is useful in trading because it can help to smooth the price data so that the trend direction can be identified.
The direction of its slope and its position relative to the current price determine the direction of the trend — when it is sloping upward and the price trades above it, the trend is to the upside (bullish trend), and when it is sloping downward and the price trades below it, the trend is to the downside (bearish trend).
As with other moving averages, the MMA can also serve as dynamic support/resistance levels depending on the market trend. In an uptrend, it can serve as a dynamic support level, and in a downtrend, it can serve as a dynamic resistance level.
How is the Modified Moving Average calculated?
The Modified Moving Average is calculated using the following formula:
MMAt = Pricet * K + MMAt-1 * (1 — K)
Where:
MMAt is the current MMA value
MMAt-1 is the previous MMA value
Pricet is the current price
K = 1/ N
N is the number of periods
Solving the MMA formula above, we can arrive at this:
MMAt = [Pricet + MMAt-1 * (N — 1)] / N
Or
MMAt = MMAt-1 + [(Pricet— MMAt-1) / N]
Thus, calculating the current MMA involves these steps:
- Obtain the current price data
- Subtract the previous MMA value from the current price data — for the first calculation, the previous MMA is an SMA.
- Divide the difference by the number of periods
- Add the result from step 3 to the previous MMA to get the current MMA
- Repeat for every new price bar and plot the data on the chart
What are the key features of the Modified Moving Average?
The key features of the Modified Moving Average include:
- It smoothens the price data better than an SMA or EMA of the same period.
- It can be used to identify the direction of the trend — if it is sloping upward, the trend is up; if it is sloping downward, the trend is to the downside; and if it is flat, the market is probably moving sideways.
- It can serve as a dynamic support level in an up-trending market and a resistance level in a down-trending market.
How does the Modified Moving Average reduce lag in price movements?
The Modified Moving Average does not reduce lag in price movements; instead, it adds lag to the price data, as it averages the data over a chosen period.
Most moving average indicators lag the price movement, and the MMA is not an exception. In fact, since smoothing the data more than an SMA or EMA of the same period, it adds more lag to the data than either of the EMA or SMA. To reduce the lag in a moving average, like the MMA, you have to use a very short period.
Can the Modified Moving Average be used in different market conditions?
Yes, the Modified Moving Average can be used in different market conditions as it helps to smooth price data so that the trend can be spotted.
However, the indicator works better if the market is trending in one direction. If the market is choppy or takes random walks in either direction, the MMA will be swinging about without any persistent trend. Such a market condition can cause the indicator to give many false signals.
What are the benefits of using the Modified Moving Average for trend analysis?
The benefits of using the Modified Moving Average for trend analysis include the following:
- The MMA smooths the data so that the direction of the trend can be identified.
- It can show dynamic levels where price swings may reverse.
- In an uptrend, you can use the indicator to track the ascending swing lows (higher lows) that characterize an up-trending market.
- In a downtrend, you can use it to track the descending swing highs (lower highs) that characterize a down-trending market.
How do traders apply the Modified Moving Average on a price chart?
To apply the Modified Moving Average on a price chart, traders have to go to the indicator section of their trading platforms to search for the indicator. Double-click on it to attach it to your chart. A settings box may pop up for you to input your preferred settings.
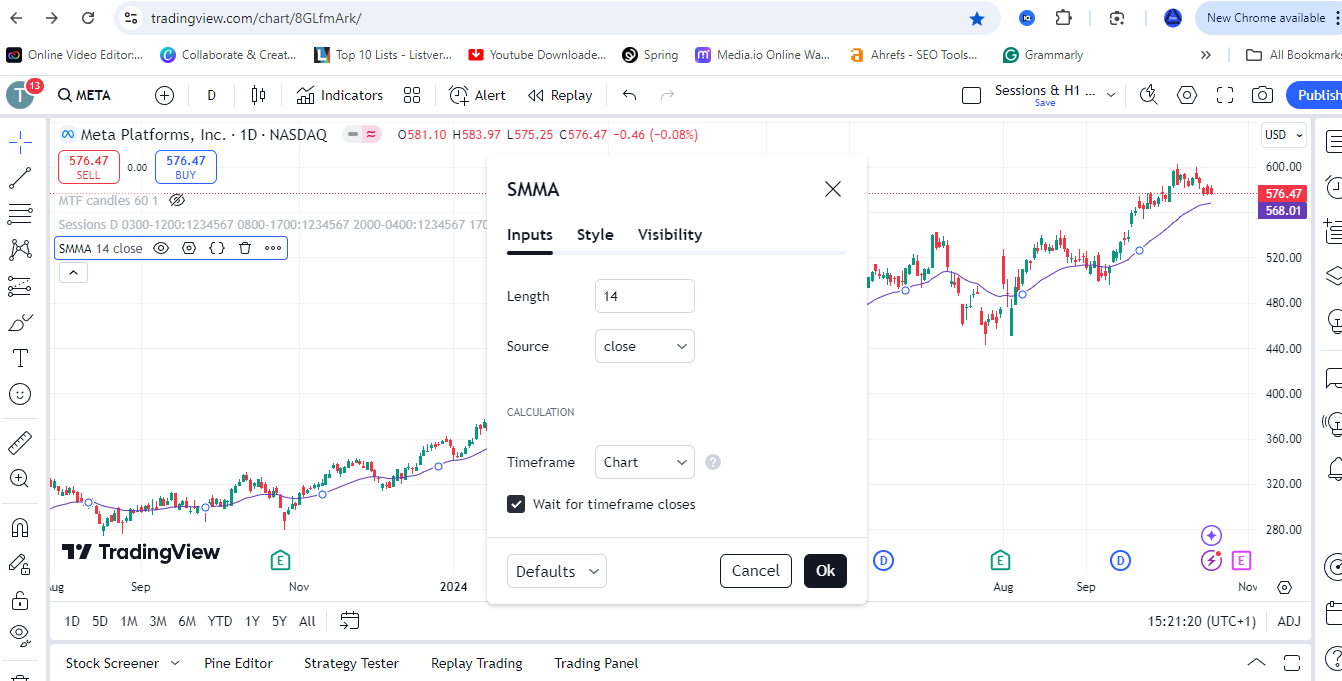
The MMA is usually available in most trading platforms, as it is one of the built-in indicators, but it may be named SMMA. However, if it is not there, you can get a programmer to code a custom MMA for your trading platform.
What settings are commonly used for the Modified Moving Average?
There are no commonly used settings for the Modified Moving Average, as traders use the settings that work best for their trading strategies. However, the default settings for the indicator on TradingView are ‘7’ for the number of periods and ‘Close’ for the price source.
As a trader, you have to backtest your strategy, experimenting with different settings to find the one that offers the best performance. Those are the settings you should use for the asset you are trading. If you move to another asset, you do a fresh backtesting to find the right settings for that market.
How does the Modified Moving Average compare to the Simple Moving Average?
Compared to the Simple Moving Average, the Modified Moving Average has a better smoothing effect on the price data. The MMA is similar to SMA in a way, as its first value is exactly an SMA.
However, it differs from the SMA in the way the subsequent values are calculated — subtracting the previous MMA value from the current price data and dividing the difference by the number of periods, and then, adding the result to the previous MMA to get the current MMA.
How does the Modified Moving Average compare to the Exponential Moving Average?
Compared to the Exponential Moving Average, the Modified Moving Average may be considered a special type of the Exponential moving average in that both use a weighting multiplier (smoothing constant) in their calculations.
However, while the EMA uses the (2/N+1) factor as its weighted multiplier constant ‘K’, the MMA uses the reciprocal of the number of periods (1/N) for that. As a result, the MMA provides more smoothing effect than an EMA of the same number of periods. In fact, a 14-period MMA is equivalent to a 28-period EMA.
Can the Modified Moving Average be combined with other indicators?
Yes, the Modified Moving Average be combined with other indicators to improve its signals and create more reliable trading strategies. Since the MMA is a trend indicator, it is best to combine it with a momentum oscillator, such as the RSI, or a volume indicator.
When combined with the RSI or stochastic, the MMA can help identify the trend while the oscillator can track individual price swings and generate entry setups to profit from an impulse swing in the trend direction. A volume indicator, on the other hand, can show when there is accumulation or distribution in the market.
What trading strategies use the Modified Moving Average?
The trading strategies that can use the Modified Moving Average include:
- Breakout strategies: These are strategies that aim to profit from the price breaking out of an accumulation or distribution zone in the market. They are best traded in the direction of the trend, identified by the MMA. A volume indicator may help confirm the breakout.
- Trend-continuation swing trades: These are swing trades taken at the end of pullbacks to ride the next impulse swing in the trend direction and exit before the next pullback. Momentum oscillators can help in these trades.
How does the Modified Moving Average help in identifying entry and exit points?
How the Modified Moving Average helps in identifying entry and exit points will depend on the strategy you use the indicator to trade and whether you use it alone. On its own, the MMA generates a buy entry when the price crosses above it after a pullback in an uptrend, and the exit signal would be the price crossing below it. A sell entry is generated when the price crosses below it after a pullback in a downtrend — the exit signal would be the price crossing above it.
What timeframes work best with the Modified Moving Average?
The timeframes that work best with the Modified Moving Average will depend on your trading style and the findings of your backtesting. If your style is day trading, you will probably focus on intraday timeframes, such as the hourly, 30-minute, 15-minute, and even 5-minute timeframes.
But the particular timeframes that offer the best day trading performance will be determined from the results of your backtesting. This is also true for swing trading where the focus is on the daily, 8-hourly, and 4-hourly timeframes.
How does the Modified Moving Average react to sudden price changes?
The Modified Moving Average reacts to sudden price changes the same way other moving average indicators react to sudden price changes — averaging the data with other data within the chosen lookback period.
Since the MMA doesn’t apply too much weight to the newer data, it doesn’t respond to sudden changes as fast as an EMA of the same period would. The indicator’s sensitivity depends on the length of its averaging period.
What are the limitations of using the Modified Moving Average?
The limitations of using the Modified Moving Average include:
- The MMA does not respond quite fast to price changes and, as such, it can lag the price action by a lot.
- It cannot track price swings fast enough to be useful for swing trading as a standalone strategy.
- Its lagging effects can lead to delayed signals and late entry/exit, which can lead to poor trading performance.
- It is not suitable for all market conditions.
How can traders optimize the settings for the Modified Moving Average?
Traders can optimize the settings for the Modified Moving Average by using the indicator to create a reliable trading strategy first. Then, they will have to backtest the strategy, experimenting with different settings to find the one that offers the best performance.
They will proceed to retest these settings on different historical data (out-of-sample data) or in a real-time market to be sure the new settings are robust enough to perform well on new price data as seen in the live market in real time. This way, they can avoid curve fitting. Also, while they trade, they should evaluate their results from time to time to know whether the new settings are still offering good performance.
Does the Modified Moving Average work well in trending or ranging markets?
The Modified Moving Average works well in trending markets and does not perform so well in ranging markets.
The reason is that the MMA is a trend indicator. Being a moving average indicator, the MMA helps to identify the direction of the trend and may serve as a dynamic support or resistance level when the market is trending. The indicator does not respond to price changes fast enough to be useful in a range-bound market.
What trading platforms support the Modified Moving Average indicator?
Most, if not all, trading platforms support the Modified Moving Average indicator. The indicator often comes preinstalled in most trading platforms.
However, it is usually labeled by its more popular name, the smoothed moving average (SMMA). So, you may not see it as the MMA on your platform, but instead, as SMMA.
How can traders backtest the Modified Moving Average in a trading strategy?
To backtest the Modified Moving Average in a trading strategy, traders should follow these steps:
- Identify and study the markets they want to backest their MMA strategy.
- Formulate their MMA strategy and state the parameters or settings they will have to experiment with.
- Gather the historical data you need for the backtesting and divide the data into in-sample and out-of-sample data.
- Convert their formulated strategy into a trading algorithm.
- Run your backtesting on the in-sample data and optimize with the out-of-sample data, adjusting your parameters as needed.
- Evaluate the results of your backtesting.
What common mistakes do traders make when using the Modified Moving
Average?
The common mistakes traders make when using the Modified Moving Average include:
- They trade without first creating a reliable trading strategy with clear entry and exit criteria
- They don’t backtest their trading strategies to be sure they have an edge in the market
- They sometimes use the indicator to trade in the wrong market condition — ranging market, for example
- Many do not have a robust risk management plan
Can the Modified Moving Average be used in automated trading systems?
Yes, the Modified Moving Average can be used in automated trading systems if the strategy created from it can be converted to a trading algorithm and is proven to have an edge in the market.
The indicator may have to be combined with other indicators or tools to create a really profitable strategy.
How can traders customize the Modified Moving Average to fit their strategy?
To customize the Modified Moving Average to fit their strategy, traders have to study the indicator to know how it works and what it can offer to their trading strategies.
More often than not, the MMA is used to identify the trend or track dynamic support and resistance levels. The key to customizing the indicator is to find the right settings that suit the market and the strategy they are trading.