The MAR Ratio: The Risk-Adjusted Performance Metric for Traders and Investors
What is the MAR Ratio and Why Should You Care?
The MAR Ratio (Managed Accounts Report Ratio) is arguably one of the most important yet underutilized performance metrics in trading and investing.
Named after the Managed Accounts Report newsletter, where it was introduced by Leon Rose in 1978, this powerful metric measures risk-adjusted returns by comparing an investment’s compound annual growth rate (CAGR) to its maximum drawdown. Thus, it’s a pretty straightforward measure.
Related reading: –Trading Performance: Strategy Metrics, Risk-Adjusted Metrics, And Backtest
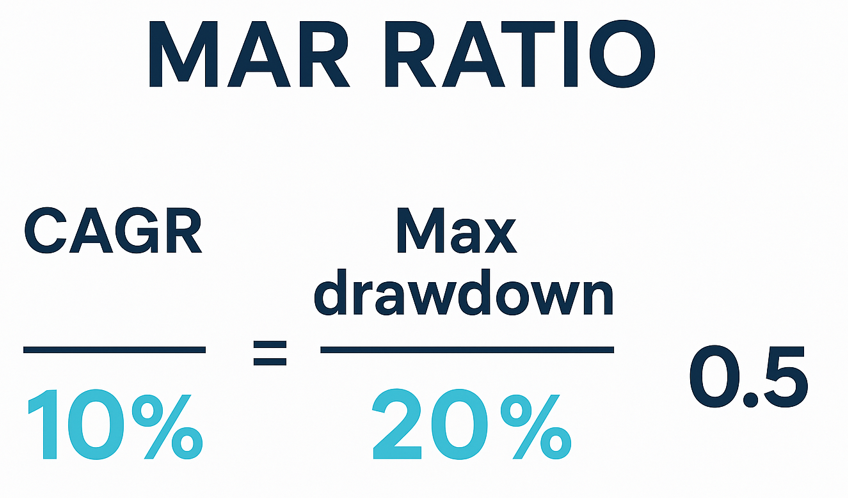
The MAR Ratio formula
MAR Ratio = CAGR / Maximum Drawdown
But don’t let its simplicity fool you. This metric can fundamentally change how you evaluate trading strategies, investment funds, and portfolio performance.
Why the MAR Ratio Outperforms Other Risk Metrics
Most traders and investors fall into the “profit trap” – focusing solely on returns while ignoring the risk taken to achieve them. Headlines like “My strategy made 50% last year!” or “I doubled my account!” tell an incomplete story. They conveniently omit the sleepless nights during 40% drawdowns or the months of capital being trapped in losing positions.
This singular focus on profits leads to:
- Unsustainable strategies that look impressive on paper but crumble under real market conditions
- Emotional trading decisions during large drawdowns
- Misleading comparisons between strategies with vastly different risk profiles
How the MAR Ratio Solves These Problems
Unlike the Sharpe Ratio (which considers total volatility) or the Sortino Ratio (which focuses on downside deviation), the MAR Ratio zeroes in on maximum drawdown—the worst-case scenario every trader fears.
This focus on drawdowns makes the MAR Ratio particularly valuable because:
- It compares apples to apples – allowing fair comparison between different strategies regardless of their approach
- It identifies robust strategies that generate returns while controlling risk
- It promotes realistic expectations by shifting focus from explosive gains to consistent, risk-managed growth
- It aligns with long-term survival – strategies with better MAR Ratios are more likely to survive market downturns
How to Calculate the MAR Ratio: Step-by-Step Guide
Let’s provide you with a straightforward example:
Compound Annual Growth Rate (CAGR – convert to decimal form): 15% = 0.15.
Maximum Drawdown (MDD):
The largest peak-to-trough decline before a new peak is achieved. For example, if your account drops from $100,000 to $60,000 before recovering, your MDD is 40%.
Let’s compare three hypothetical strategies:
- Strategy A: CAGR of 20%, Max Drawdown of 25% → MAR Ratio = 0.80
- Strategy B: CAGR of 30%, Max Drawdown of 50% → MAR Ratio = 0.60
- Strategy C: CAGR of 15%, Max Drawdown of 10% → MAR Ratio = 1.50
Strategy C, despite having the lowest absolute return, has the highest MAR Ratio due to superior risk control. This illustrates why the MAR Ratio is so powerful – it forces you to consider the often-overlooked aspect of risk management.
What Constitutes a “Good” MAR Ratio?
Based on extensive backtesting across hundreds of strategies, here are realistic benchmarks:
- Below 0.2: Poor risk-adjusted returns, often indicating high drawdowns relative to gains
- 0.2 – 0.4: Where many robust, practical strategies fall – a reasonable balance of return and risk
- 0.5 and above: Excellent performance indicating superior risk management (our minimum threshold for serious consideration)
- 1.0+: Extremely rare for standalone strategies – be cautious of over-optimization if you consistently find these
For diversified portfolios, portfolio MAR ratios should be significantly higher due to diversification benefits:
- 0.75 to 1: The most realistic for most traders
- 1.0+ (Minimum Target): Should be the goal for any serious trading portfolio
- 1.5+: Excellent performance showing exceptional strategy selection
- 2.0+: World-class performance indicating sophisticated risk management
Key Takeaways for Better Trading Performance
The MAR Ratio is a good friend for evaluating risk-adjusted performance. Aim for 0.5+ MAR Ratios in individual strategies and 0.75+ in diversified portfolios.
Remember: true trading success isn’t just about how much you make, but how you make it and how much you risk in the process. The MAR Ratio provides the clarity you need to make these critical distinctions and build a more robust, sustainable trading approach.