The Benner Cycle Explained: History and How Traders Use It
Few market forecasting tools have sparked as much fascination—and controversy—as the Benner Cycle. Developed more than a century ago, the Benner Cycle claims to identify recurring patterns in market tops, bottoms, and periods of economic stress. Despite its age, it continues to resurface in discussions about market timing, bubbles, and long-term investment cycles.
This article provides the most comprehensive, balanced, and evidence-based explanation of the Benner Cycle available online. We examine its origins, structure, historical performance, practical applications, and limitations—without hype or mysticism.
Related Reading: –Full trading indicators list
Key Takeaway
- The Benner Cycle is a historical, time-based framework that highlights recurring periods of market stress and speculation, but it does not provide precise timing or actionable trading rules.
- While some major market crises loosely align with Benner Cycle windows, the relationship is inconsistent and insufficient for standalone forecasting or trading decisions.
- The cycle cannot be robustly backtested without introducing subjective assumptions, which significantly weakens its statistical reliability.
- In modern markets, the Benner Cycle is best used as a macro-context or risk-awareness tool, not as a predictive model or mechanical strategy.
- Sustainable trading and investing performance comes from rule-based systems, rigorous backtesting, and risk management—not from relying on historical cycles alone.
What Is the Benner Cycle and How Does It Work?
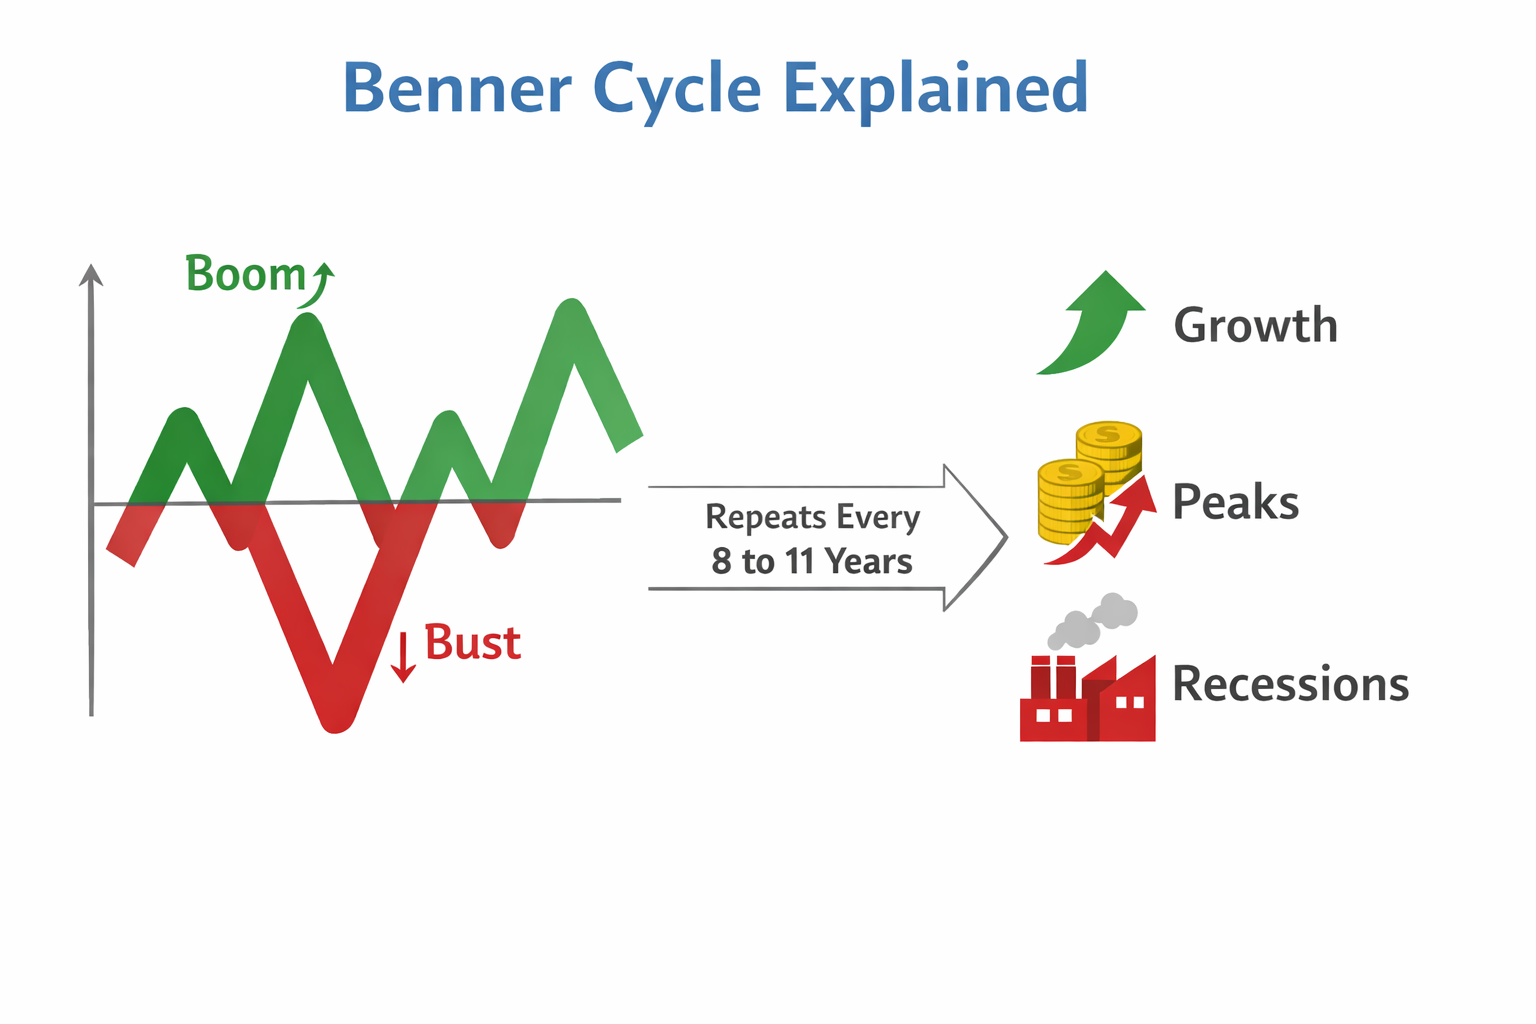
The Benner Cycle is a long-term market cycle theory developed in the late 1800s. It proposes that financial markets and economic conditions move in recurring time-based patterns, producing predictable periods of:
- Panic and distress
- Recovery and growth
- Speculative excess and market tops
At its core, the Benner Cycle is time-based, not price-based. Unlike technical indicators that rely on price action or momentum, the Benner Cycle focuses solely on calendar years and their historical tendency to align with economic turning points.
The cycle is typically represented as three overlapping sequences:
- Panic Years – Associated with market bottoms and economic stress
- Good Times – Periods of expansion and prosperity
- Speculative Peaks – Times of optimism, excess leverage, and market tops
These sequences repeat at irregular but structured intervals, often cited as roughly 8–11 years for panics and longer multi-decade supercycles.
Who Was Samuel Benner and Why Did He Create the Benner Cycle?
Samuel T. Benner was an Ohio farmer and trader who lived through the Panic of 1873, one of the most severe economic crises of the 19th century. Benner lost nearly everything during the collapse.
Rather than abandoning markets, he embarked on a historical study of economic panics, commodity prices, and business cycles dating back to the early 1800s. His goal was practical—not academic:
To avoid future financial ruin by understanding when markets were most vulnerable.
In 1875, Benner published a pamphlet titled “Benner’s Prophecies of Future Ups and Downs in Prices”. In it, he outlined a cycle of recurring panic years based on historical observation.
Importantly, Benner never claimed supernatural foresight. His work was empirical, rooted in historical pattern recognition—a precursor to modern quantitative finance.
How Accurate Has the Benner Cycle Been Historically?
This is the most critical—and most misunderstood—question.
Documented Alignments
Supporters often point out that several major market events align reasonably well with Benner Cycle panic or peak years, including:
- 1873 – Panic of 1873
- 1893 – Panic of 1893
- 1907 – Banking panic
- 1929–1932 – Great Depression
- 1973–1974 – Oil crisis and bear market
- 2000 – Dot-com bubble peak
- 2008 – Global Financial Crisis
These alignments are not perfect, but they are notable enough to explain why the cycle continues to attract attention.
Statistical Reality
However, from a strict statistical standpoint:
- The cycle does not consistently predict exact tops or bottoms
- Some predicted panic years pass with little market disruption
- Many market crashes occur outside Benner Cycle windows
In short: the Benner Cycle shows partial historical correlation, not deterministic predictive power.
Does the Benner Cycle Actually Predict Stock Market Crashes?
The honest answer is: sometimes, loosely—but not reliably enough to trade blindly.
The Benner Cycle does not specify:
- Magnitude of market moves
- Direction (top vs. bottom) with precision
- Asset class specificity (stocks vs. commodities vs. bonds)
What it does appear to highlight is periods of elevated systemic risk, when markets may be more fragile due to leverage, speculation, or macroeconomic imbalances.
Used improperly, the Benner Cycle can lead to premature exits or missed opportunities. Used cautiously, it can serve as a contextual risk-awareness tool.
How Is the Benner Cycle Different From Elliott Wave or Kondratiev Cycles?
While often grouped together, these cycles differ fundamentally.
Benner Cycle
- Time-based
- Historical and observational
- No price targets or wave counts
- Broad macro focus
Elliott Wave
- Price-based and fractal
- Highly subjective in application
- Focuses on crowd psychology
- Requires wave labeling
Kondratiev Wave
- Multi-decade economic supercycles
- Tied to credit expansion and innovation
- Often spans 40–60 years
The Benner Cycle is the simplest and least technical of the three—and also the least precise.
What Are the Key Dates or Turning Points in the Benner Cycle?
Different versions of the Benner Cycle exist, but most include clusters of years rather than exact points.
Commonly cited panic or inflection years include:
- Late 1870s–1890s
- Early 1900s
- Late 1920s–1930s
- Early 1970s
- Early 2000s
- Late 2000s
Modern interpretations often extrapolate these sequences forward, but such projections are highly speculative and should not be confused with forecasts.
Can the Benner Cycle Be Used for Modern Stock Markets and ETFs?
This is where modern traders must be especially careful.
Financial markets today differ radically from Benner’s era:
- Central banks actively manage liquidity
- Algorithmic and high-frequency trading dominate volume
- Global capital flows move faster than ever
- Structural changes (ETFs, derivatives, leverage) alter market dynamics
As a result, the Benner Cycle cannot be used as a standalone trading system in modern markets.
However, it can still provide macro context, particularly when combined with:
- Valuation metrics
- Volatility regimes
- Trend-following filters
- Credit spreads
How Do Traders and Investors Apply the Benner Cycle in Practice?
Experienced practitioners use the Benner Cycle in three limited ways:
1. Risk Awareness
When markets enter historically risky Benner windows, traders may:
- Reduce leverage
- Tighten risk controls
- Avoid aggressive mean-reversion strategies
2. Macro Overlay
The cycle can serve as a background filter, influencing portfolio exposure rather than trade timing.
3. Narrative Stress Testing
Investors may use it to challenge overly bullish assumptions during late-cycle optimism.
Crucially, professionals do not enter or exit positions solely because “the Benner Cycle says so.”
What Are the Main Criticisms and Limitations of the Benner Cycle?
The Benner Cycle faces substantial criticism, much of it valid.
Key Limitations
- Data mining risk: Patterns identified after the fact
- Survivorship bias: Famous crashes are remembered; misses are ignored
- Lack of falsifiability: Vague time windows allow reinterpretation
- No trading rules: No entries, exits, or position sizing
From a quantitative perspective, the Benner Cycle fails most standards of robust system design.
Is the Benner Cycle Still Relevant in Today’s Data-Driven Markets?
Yes—but only in a narrow and disciplined sense.
The Benner Cycle remains relevant as:
- A historical curiosity
- A reminder that markets move in regimes
- A caution against linear thinking
It is not a predictive engine.
In modern markets, edge comes from:
- Robust backtesting
- Rule-based systems
- Risk management
- Statistical validation
The Benner Cycle can complement this framework—but never replace it.
Benner Cycle vs. Backtested Strategies: A Critical Comparison
From a systematic trading perspective, the contrast is stark.
| Benner Cycle | Backtested Strategy |
|---|---|
| Time-based | Price- and data-based |
| No rules | Explicit rules |
| No metrics | Measurable performance |
| Narrative-driven | Evidence-driven |
The Benner Cycle offers intuition. Quantitative strategies offer verification.
Final Thoughts: How to Think About the Benner Cycle Rationally
The enduring appeal of the Benner Cycle lies in a simple truth:
Markets are cyclical, and human behavior repeats.
However, recognizing cycles is not the same as profiting from them.
For modern traders and investors, the Benner Cycle is best viewed as:
- A historical lens
- A macro risk reminder
- A supplement to data—not a substitute
Those who respect its limitations can extract value. Those who treat it as prophecy usually pay the price.
FAQ
Can the Benner Cycle Be Backtested Systematically?
The Benner Cycle can be partially backtested, but only in a very constrained and indirect way. Because the cycle provides no explicit trading rules, price levels, or asset definitions, any backtest requires subjective assumptions—such as defining “panic years” as buy signals or “speculative years” as sell signals. These assumptions introduce researcher bias, making results highly sensitive to parameter choices. As a result, most Benner Cycle backtests lack robustness and fail out-of-sample validation.
Does the Benner Cycle Apply to Individual Stocks or Only to the Broad Market?
The Benner Cycle is a macro-level framework and was never intended for individual stocks. Its historical observations relate to broad economic conditions and aggregate market behavior, not company-specific price dynamics. Applying the cycle to single stocks typically produces inconsistent and unreliable results.
Is the Benner Cycle Based on Economics or Investor Psychology?
The Benner Cycle is best described as a hybrid. While Benner observed economic events such as panics and depressions, the recurring nature of the cycle implicitly reflects human behavior—particularly fear, speculation, and overconfidence. However, unlike modern behavioral finance, the cycle does not formally model psychological mechanisms.
Why Do Different Sources Show Different Versions of the Benner Cycle?
Multiple versions exist because Samuel Benner’s original work was brief, informal, and published in the 19th century. Later authors have reinterpreted, extended, or modified the cycle, often shifting dates or emphasizing different components. This lack of a single canonical version is one of the major reasons the cycle is difficult to validate rigorously.
Can the Benner Cycle Be Combined With Quantitative Indicators?
Yes, but only as a secondary or contextual input. Some traders use Benner Cycle windows as a high-level regime filter, while relying on quantitative indicators—such as trend, volatility, or breadth—for actual decision-making. In this setup, the Benner Cycle informs risk posture rather than generating trades.