
Bitcoin Portfolio: Backtest, Allocations and Analysis
For a long time, there has been debate about whether a classic investment portfolio should add cryptocurrencies. The debate gained traction when famous institutional investors secured a stake of their capital in Bitcoin. Should Bitcoin be a part of your portfolio? Let’s find out:
Yes, history shows Bitcoin should be a part of your investment portfolio. Our backtests show the importance of diversifying your investment portfolio. Bitcoin offers that with a low correlation to the market, providing superior returns on assets used for the same purpose and positively impacting portfolio metrics. However, there is no guarantee history will repeat itself.
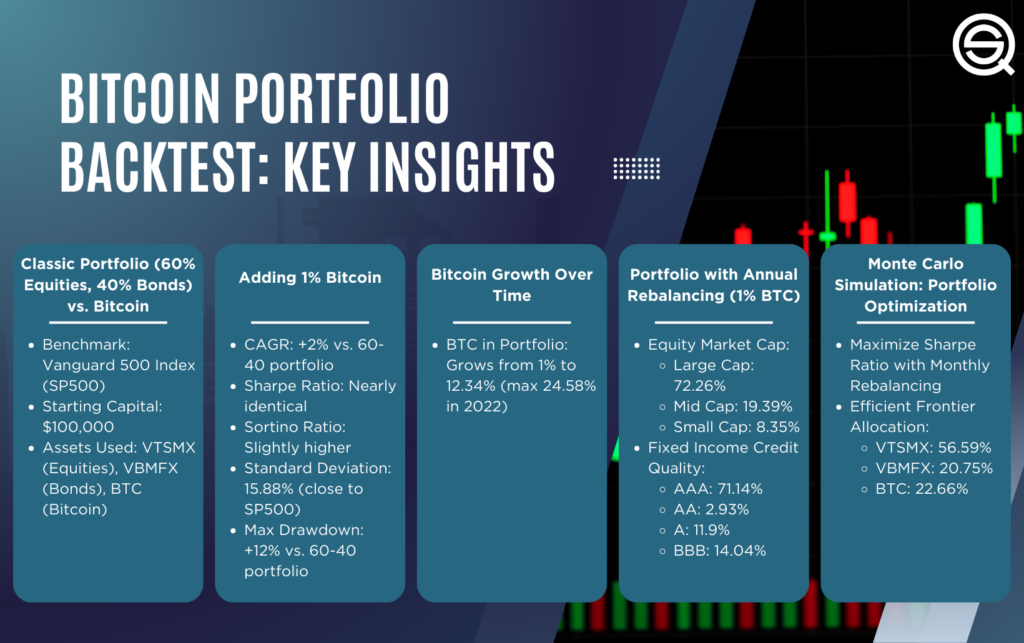
How much crypto should be in your portfolio? This article investigates how adding Bitcoin to certain percentages in a classic portfolio impacts its metrics. We use a starting capital of $100,000. We use the ETF Vanguard Total Stock Mkt Idx Inv (VTSMX) as a proxy for equities. For bonds, we use the EFT Vanguard Total Bond Market Index Inv (VBMFX), and, of course, the BTC spot price.
Key Takeaways
- Bitcoin improves diversified portfolio performance
- Low correlation enhances portfolio diversification benefits
- Small Bitcoin allocation boosts long-term returns
- Annual rebalancing controls crypto portfolio risk
- Monte Carlo simulations optimize Bitcoin allocation
- Efficient frontier identifies optimal crypto weighting
- Bitcoin increases Sharpe and Sortino ratios
- Diversified portfolios benefit from crypto exposure
You might want to click here if you are looking for an investment strategy.
The good old 60-40 classic portfolio and Bitcoin
For decades, the 60% equities and 40% bonds distribution in the classic portfolio has been the investment choice for retirement, that is, for the conservative investor.
This composition uses stocks as a growth engine and softens market volatility with fixed income from bonds. Financial advisors place their clients’ assets in portfolios with risk tolerance profiles, time horizons, and defined financial goals.
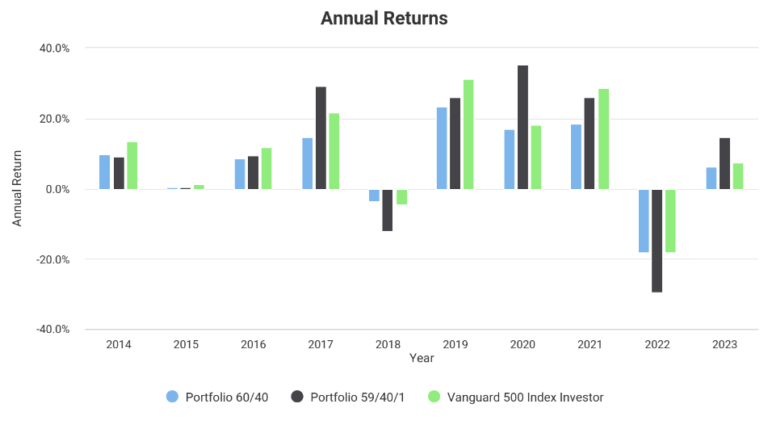
To simplify our model in this article, we assume zero cash flows (there will be no income or capital outflow), no rebalancing, and we will not reinvest the generated dividends. Our benchmark will be the Vanguard 500 Index Investor (SP500).
What percentage of Bitcoin should be in the portfolio?
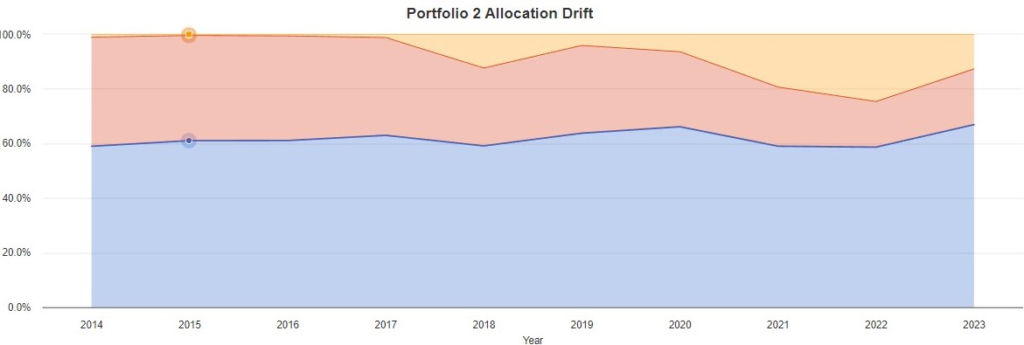
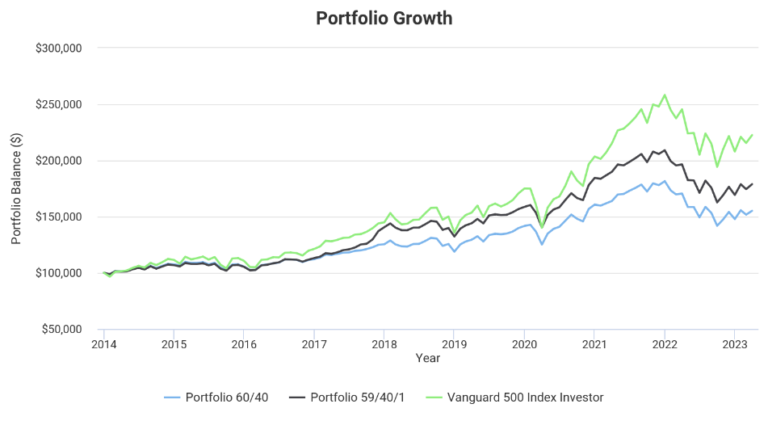
For our first case study and backtest, we use the aforementioned 60-40 classic portfolio, but we add 1% Bitcoin, which will come from the equity percentage. Due to limited Bitcoin market data, our analysis range is from January 2014 to March 2023.
Here are the statistics and performance metrics:

With a CAGR increase of over 2% versus the original portfolio, an almost identical Sharpe Ratio, and a slightly higher Sortino Ratio, the first thing we notice is a significant improvement in the performance of the portfolio model by adding only 1% BTC. The standard deviation was very close to the SP500 at 15.88%.
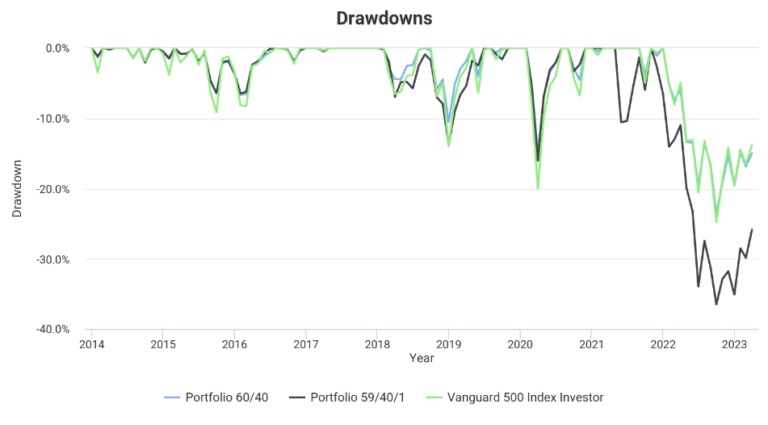
On the other hand, we cannot overlook the max drawdown, which is over 12 percentage points more than the 60-40 portfolio.
But why does the portfolio improve when adding Bitcoin? The answer is obvious: the percentage of BTC grew over time from an initial 1% to a final 12.34%, with a maximum of 24.58% in 2022.
Remember that in our case study, we decided not to rebalance the portfolio, and this is seen in the following chart:
Here are some interesting graphics of this model and our benchmark:

Here are more details about the composition of our classic portfolio:
Equity market capitalization:
- Large Cap: 72.26%
- Mid-Cap: 19.39%
- Small Cap: 8.35%
Fixed income credit quality:
- AAA 71.14%
- AA 2.93%
- A 11.9%
- BBB 14.04%
Should investors include Bitcoin in their portfolios?
Now, in order to reduce our exposure to Bitcoin, we have also applied annual rebalancing to the same portfolio model we used above. This is the results

The return is still higher than the classic 60/40 portfolio, notably improving the Sharpe and Sortino ratios. Our maximum drawdown and standard deviation are also lower than our benchmark (S&P 500).
Portfolio Optimization with Bitcoin
It’s clear that not all investors are the same, and there is an appropriate risk model for each one. There are those who are “all in” and those who are more conservative, but we cannot ignore the overall positive impact that BTC can have on an investment portfolio.
Some investors may not tolerate certain levels of drawdown or deviation in their investments, and to objectively assess these aspects, we can perform a strategy optimization for our model. To do this, we will maximize the Sharpe ratio using Monte Carlo simulation and monthly rebalancing using the same financial assets we used earlier in the article.
Monte Carlo simulation and Bitcoin (in the portfolio)
Portfolio optimization using Monte Carlo is a method that uses simulations based on random numbers to aid in investment decision-making. Using this method, multiple random scenarios of market behavior are generated and used to simulate the performance of different asset combinations in a portfolio.
Then, the profitability and risk of each asset combination are evaluated to identify the one with the best balance between risk and return. By using Monte Carlo simulations, many more factors and variables can be considered in portfolio optimization.
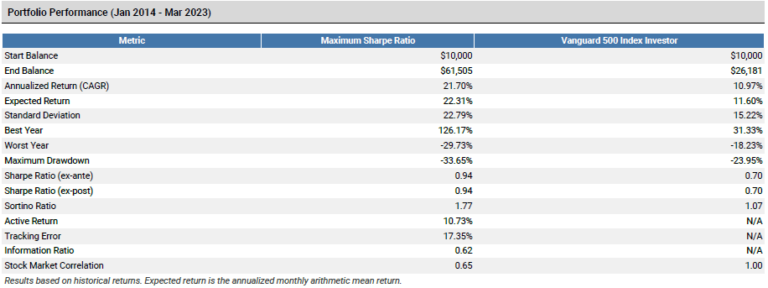
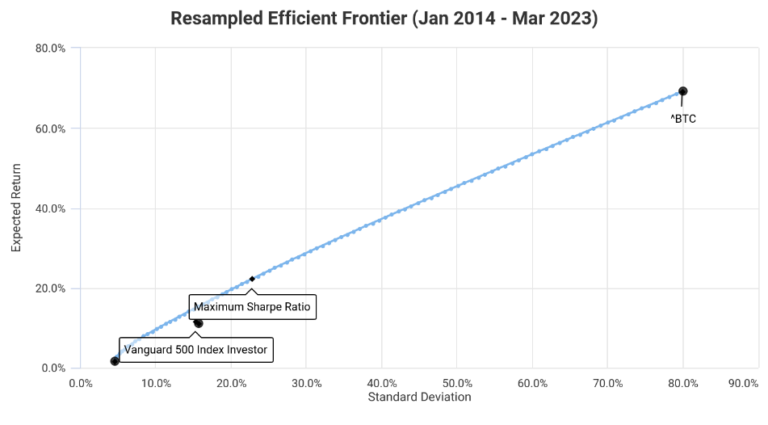
Efficient Frontier of the portfolio when including Bitcoin
What percentage of Bitcoin (crypto) should be in the portfolio?
The efficient frontier is the set of optimal portfolios that offer the highest expected return for a defined level of risk or the lowest risk for a given level of expected return.
Portfolios that lie below the efficient frontier are sub-optimal because they do not provide enough return for the level of risk.
Portfolios that cluster to the right of the efficient frontier are sub-optimal because they have a higher level of risk for the defined rate of return.
The asset allocation closest to the efficient frontier is as follows:
- VTSMX 56.59%.
- VBMFX 20.75%
- BTC 22.66 %
Here is the equity curve:
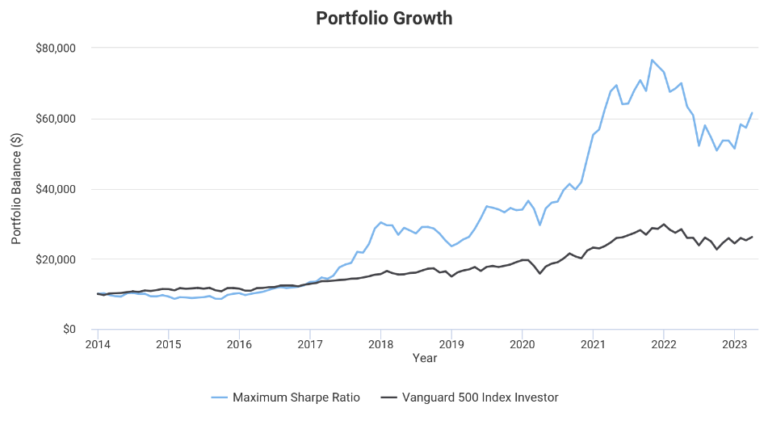
Maintaining a diversified portfolio is key in the long term, and Bitcoin still gives us that edge over many assets in the traditional market.
Here is a correlation table including the gold price:
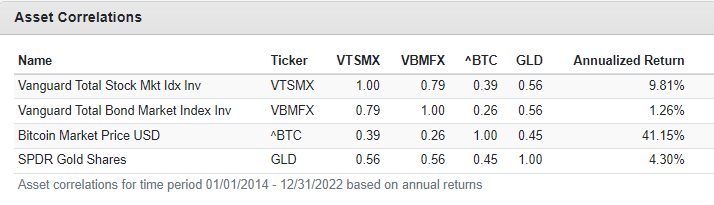
As you can see, Bitcoin and gold offer low correlation to stocks, especially bonds.
Portfolio diversification with Bitcoin – do you need it in your portfolio?
In general, it has been observed that Bitcoin has a very low or even negative correlation with classic financial assets such as stocks, bonds, and commodities. This means that when the prices of these assets rise, the price of Bitcoin does not necessarily follow suit and vice versa.
- Portfolio Of Strategies – Adding a Strategy To Your Trading (Correlation and Diversification)
- What Does Correlation Mean In Trading Strategies?
For example, during the COVID-19 pandemic in 2020, stock and commodity prices fell drastically, while the price of Bitcoin remained relatively stable and even rose at times. This suggests that Bitcoin could have a role as a safe-haven asset in times of market uncertainty.
However, it is important to note that Bitcoin’s correlation with classic financial assets can be volatile and may change over time. The only sure thing about correlation is that it varies over time! And often correlations increase when you need it the most.
Additionally, since Bitcoin is a relatively new asset class and is not yet widely accepted as a legitimate asset by many investors, its relationship with classic financial assets could change as the market evolves.
In 2020, CoinShares, an institutional cryptocurrency investment management firm, published an analysis on the role of Bitcoin in an investment portfolio. The study called Bitcoin’s role in an investment portfolio, shows the effect of including Bitcoin in an investment portfolio.
In the analysis, CoinShares uses a 4% allocation to Bitcoin in a traditional portfolio and compares it to other diversifying assets. Their conclusion was this:
Our analysis highlights that Bitcoin not only enhances returns but also increases diversification, regardless of when an investor decides to invest.
In 2021, Ecoinometrics published an analysis in its newsletter on the 3rd of February 2021 of the impact of including Bitcoin in an investment portfolio with various percentages of assets from the S&P500 index and gold. Among the premises of the analysis, Ecoinometrics did not include bonds in the portfolio but varied the percentages of Bitcoin, S&P500, and gold to illustrate the impact of including Bitcoin.
Goldman Sachs Group Inc highlighted Bitcoin as the best-performing asset in terms of absolute and risk-adjusted returns in early 2023. Then came the banking crisis, and the largest cryptocurrency rose to its highest price in ten months. Jamie Douglas Coutts, Senior Market Structure Analyst at Bloomberg Intelligence, points out that Bitcoin has just recorded its second-best quarter in a decade: a strong first quarter typically translates into higher prices later in the year.
Should Bitcoin be part of your portfolio – conclusion
Should crypto be part of your portfolio? We have seen the importance of diversifying an investment portfolio. Bitcoin offers exactly that with a low correlation to the market, providing superior returns on assets used for the same purpose and positively impacting portfolio metrics.
Each investment model must carefully study its time horizon, expected return, and risk profile. With these aspects well defined, determine the percentage of Bitcoin to include in its investment plan. Also, the past might never replicate the future.
Sources:
- Bitcoin merece algo de espacio en tu portafolio – bloomberglinea.com
- Conoce las estrategias para la inclusión de bitcoin en un portafolio de inversión – criptonoticias.com
- Qué beneficios tiene la inclusión de bitcoin en portafolios de inversión tradicionales – criptonoticias.com
- Bitcoin’s role in an investment portfolio – coinshares.com
- Ecoinometrics – February 03, 2021 – ecoinometrics.substack.com
- Graphics and Statistics – portfoliovisualizer.com
FAQ:
How much of my portfolio should be allocated to Bitcoin?
The allocation of Bitcoin in a portfolio depends on individual risk tolerance, investment goals, and time horizon. The article provides a detailed analysis of different scenarios, including a 1% allocation and an optimized allocation based on Monte Carlo simulations. Investors should carefully consider their financial objectives before deciding on a specific percentage.
What is the impact of adding 1% Bitcoin to a classic 60-40 portfolio?
Adding 1% Bitcoin to a classic 60-40 portfolio can significantly improve the portfolio’s performance. The backtest results show an increase in Compound Annual Growth Rate (CAGR) by over 2%, an almost identical Sharpe Ratio, and a slightly higher Sortino Ratio. The portfolio’s standard deviation remains close to the S&P 500, but the maximum drawdown increases.
How does Bitcoin affect the performance of a diversified portfolio with annual rebalancing?
Including Bitcoin in a diversified portfolio with annual rebalancing can enhance returns and improve risk-adjusted metrics. The article presents results showing higher returns than a classic 60-40 portfolio, along with improved Sharpe and Sortino ratios. The maximum drawdown and standard deviation are also lower than the benchmark (S&P 500).