

Price Compression Trading Strategy

Today, we discuss a price compression trading strategy.
Markets often move from quiet periods to active periods.
This simple observation is the foundation of many breakout strategies. When price movement becomes unusually narrow, it can signal that buyers and sellers are temporarily in balance. The market is resting, waiting, or building energy. It’s like a coil.
NR 7 Pattern
One classic way to identify this kind of price compression is Toby Crabel’s NR7 pattern.
NR7 stands for Narrow Range 7. It means that today’s trading range, the difference between the high and the low, is the narrowest range of the last seven trading days.
In other words, the market has compressed.
The basic idea is straightforward:
When volatility contracts, volatility may soon expand.
A simple price compression strategy can be built like this (as suggested originally by Mr. Crabel):
- Calculate the daily range: high minus low.
- Compare today’s range with the previous six trading days.
- If today has the narrowest range of the seven days, mark the high and low of that day.
- A breakout above the NR7 high can be treated as a bullish signal.
- A breakdown below the NR7 low can be treated as a bearish signal.
Advantages of Price Compression
Such a strategy is different than classical mean reversion strategies, and thus it might offer diversification benefits.
Price Compression Trading Strategy
We quantified some trading rules (see rules at the bottom), and we got the following equity curve:
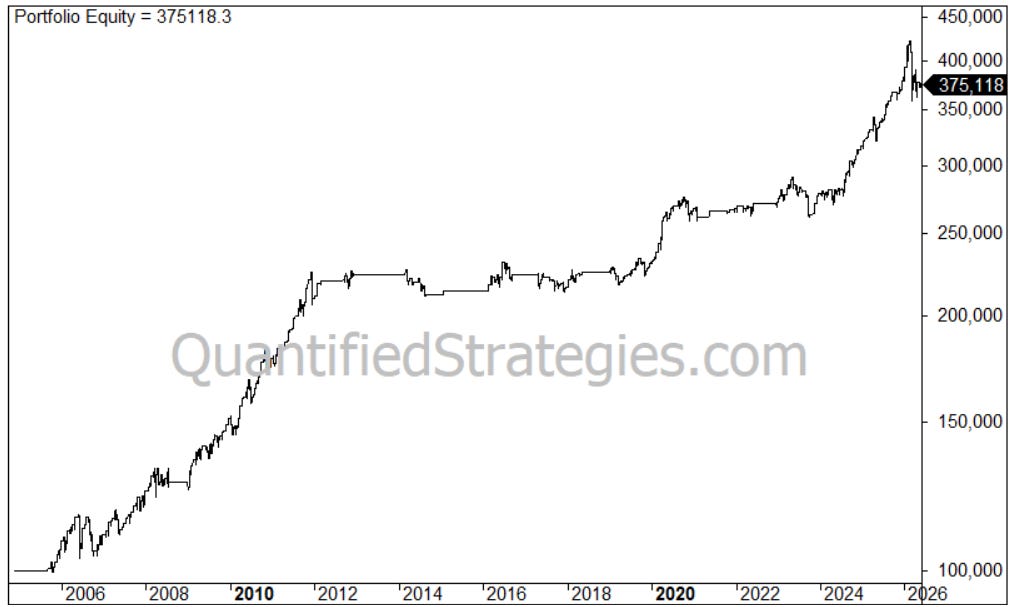
Strategy type: Breakout strategy.
Market: The gold price (GLD).
Performance
- No. of trades: 445
- Average gain per trade: 0.3%
- Win ratio: 71%
- Profit factor: 2
- Annual returns (CAGR): 6.3%
- Exposure/time in the market: 21%
- Risk-adjusted return: 29% (CAGR divided by time spent in the market (0.21))
- Max drawdown: 15%
The upside is that the strategy can be further improved with a better trend filter.