
Moving Average Crossover Strategy: Signals, Setups, Backtest, and Practical Trading Uses
A moving average crossover strategy uses two or more moving averages to generate objective buy and sell signals based on trend shifts. When the lines cross, traders have a clear, rule-based trigger for potential entries and exits. This approach removes much of the guesswork from trading decisions.
Later in the article, we present a backtested moving-average crossover strategy.
Related reading: 20 Types Of Moving Average Trading Strategies
Quick Overview of the Moving Average Crossover Strategy
A moving average crossover occurs when a shorter-period (faster) moving average intersects a longer-period (slower) moving average on a price chart. This intersection creates a mechanical signal that traders interpret as a shift in momentum—either bullish when the fast MA crosses above, or bearish when it crosses below.
What you will learn:
- How moving average crossovers work and why they generate trading signals
- Common setups including price crossovers, double MA, and triple MA strategies
- Famous signals like the golden cross and death cross
- Strengths and weaknesses of average crossover strategies
- How to reduce false signals using filters and confirmation tools
Consider a real-world example: In mid-2020, the S&P 500’s 50-day SMA crossed above its 200-day SMA following the COVID crash—a classic golden cross that signaled the start of a substantial recovery rally. This type of signal draws significant attention from institutional investors and financial media.
The strategy applies across stocks, forex, crypto, indices, and commodities on timeframes ranging from 1-minute charts to weekly bars.
What Is a Moving Average in Trading?
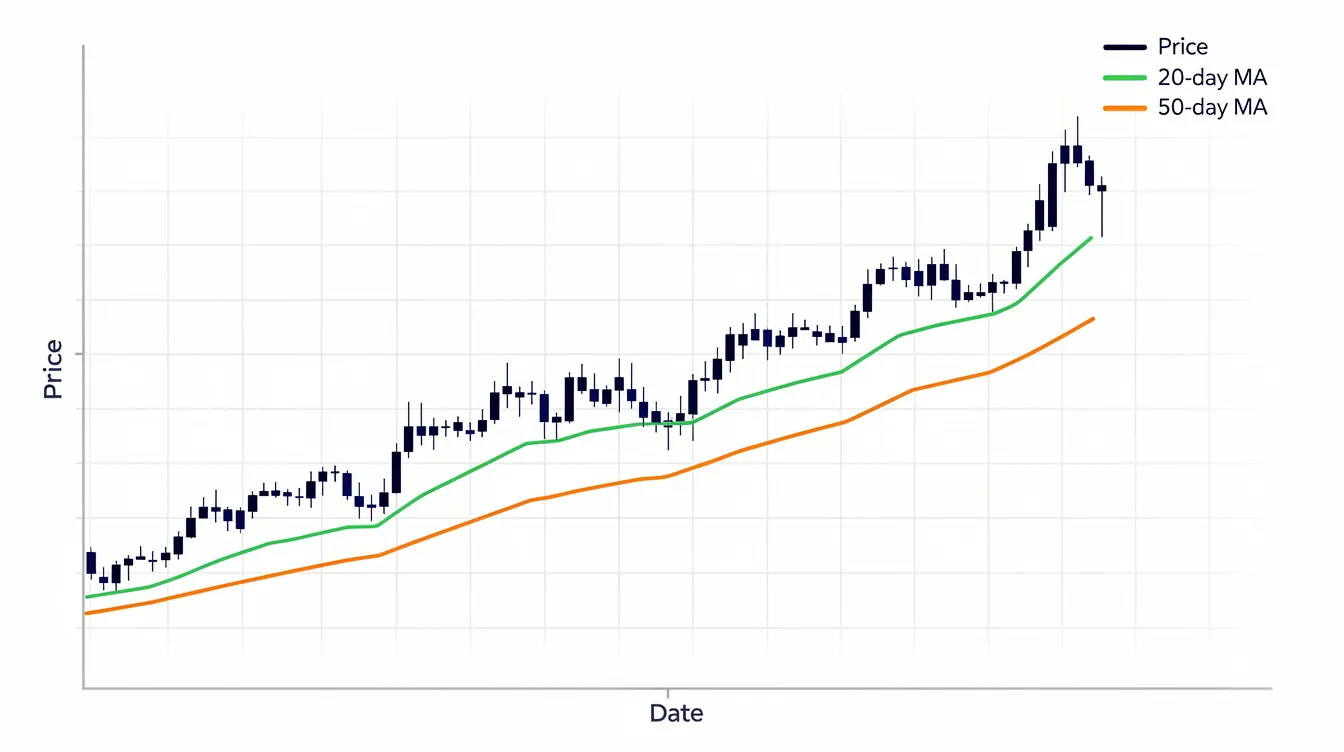
A moving average is the arithmetic mean of closing price data over a fixed number of periods. A 20-day simple moving average, for example, sums the last 20 closing prices and divides by 20. As each new trading day ends, the oldest price drops out and the newest enters, creating a continuously updating average.
How moving averages help traders:
- They smooth out market noise and short-term fluctuations
- They reveal the underlying trend direction more clearly than raw price data
Typical lookback periods serve different purposes:
| Period | Common Use Case |
|---|---|
| 10–20 days | Day trading, short term trend identification |
| 50 days | Swing trades, intermediate trends |
| 100–200 days | Long-term investing, position trading |
The simple moving average SMA gives equal weight to all prices in the lookback window, producing smooth, stable readings. The exponential moving average applies more weight to recent prices, making it react faster to new price data. EMAs are typically preferred for shorter timeframes, while SMAs work well for longer-term analysis.
What Is a Moving Average Crossover?
A moving average crossover is the precise moment when one moving average crosses another on a chart. This event signals a potential shift in momentum and forms the basis of many trading strategies used in technical analysis.
Fast vs. slow moving averages:
- Fast MA (shorter period): Reacts quickly to recent price changes
- Slow MA (longer period): Represents the broader trend direction
Common period combinations include:
- 9/21 EMA for intraday and short-term trading
- 20/50 SMA for swing trades
- 50/200 SMA for long-term trend following
A bullish crossover happens when the fast moving average crosses above the slow MA, suggesting rising momentum and a potential uptrend. A bearish crossover occurs when the fast MA crosses below the slow MA, indicating weakening momentum and possible downtrend.
Moving average crossovers work best in trending markets and tend to generate false signals in sideways or choppy markets where price lacks directional conviction.
Core Moving Average Crossover Strategies
Traders use several standard variations of the moving average strategy, each offering different balances between signal frequency and reliability.
Main strategies covered:
- Price vs. moving average crossover
- Double moving average crossover (including golden cross and death cross)
- Triple moving average crossover
- Moving average ribbon
Each approach has distinct parameters and use cases. The choice depends on your trading style, time horizon, and tolerance for trade frequency.
Price vs Moving Average Crossover Strategy
This is the simplest crossover technique. Signals generate when price itself crosses above or below a single moving average, rather than comparing two moving averages.
Buy signal: Price closes above the chosen moving average after trading below it, suggesting a shift from bearish to bullish momentum.
Sell signal: Price closes below the moving average after trading above it, indicating loss of upward momentum.
For instance, on a daily chart of Apple (AAPL), a trader might buy when price closes above the 50-day SMA after a multi-week decline, interpreting this as a potential trend reversal entry.
Pros: Minimal parameters, easy to implement, generates frequent signals
Cons: More sensitive to market noise, produces more whipsaws during choppy periods
Double Moving Average Crossover Strategy
The double MA crossover is the most widely adopted approach. It compares two moving averages of different periods and generates signals at their intersection.
Setup examples:
- 9/21 EMA for short-term day trading
- 20/50 SMA for swing trades
- 50/200 SMA for long-term position trading
Buy rule: Enter long when the fast MA closes above the slow MA. Many traders require both averages to slope upward and price to trade above both lines.
Sell rule: Exit or go short when the fast ma crosses below the slow ma.
A trader could buy EUR/USD when the 9 EMA crosses above the 21 EMA on a 4-hour chart and exit when the 9 EMA crosses back below. This provides clear entry and exit signals without ambiguity.
Double MA crossovers balance simplicity and reliability, making them the first systematic strategy many technical traders test on historical data.
Golden Cross and Death Cross Signals
The golden cross occurs when the 50-day SMA crosses above the 200-day SMA. This signal marks a major bullish shift and receives extensive coverage in financial markets.
The death cross is the opposite—the 50 day SMA crossing below the 200 day SMA. It often signals prolonged downside or bear-market conditions.
Historical example: After the COVID crash in March 2020, the S&P 500 formed a golden cross in mid-2020, confirming the start of a powerful bull run. Traders who recognized this crossover signal captured significant gains.
These crosses attract institutional investors, financial media, and retail traders alike. The increased attention often creates higher volume around crossover dates.
Despite their fame, golden crosses and death crosses are lagging indicators. By the time the signal appears, a significant portion of the price move has already occurred.
In our opinion, moving averages work best for crypto and stocks. For stocks, the best crossover combination is pretty close to the Golden Cross strategy. We did an optimization, and the value for the short moving average should be like 25% of the long one.
Let’s backtest the golden cross strategy for the S&P 500 from 1960 until today(excluding dividends):
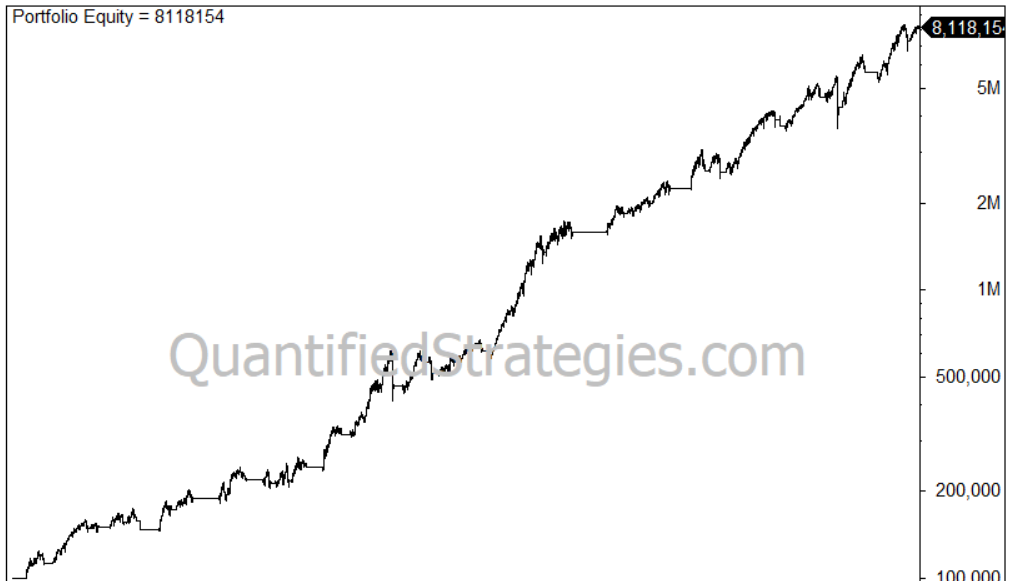
The annual return is 6.9% compared to 7.4% for buy and hold. However, you are invested at only 70%, so the risk-adjusted return is 9.88%. Max drawdown is 33% compared to buy-and-hold’s 55%.
Triple Moving Average Crossover Strategy
The triple MA strategy uses three moving averages—fast, medium, and slow—to improve confirmation and filter out weaker crossover signals.
Common combinations:
- 10/20/50 EMA for shorter-term trading
- 20/50/200 SMA for position trading
Bullish condition: Fast MA above medium, medium above slow—a “stacked alignment” confirming strong upward momentum.
Bearish condition: Fast MA below medium, medium below slow, indicating a strong downtrend environment.
This approach generates fewer but higher-quality entry and exit signals, appealing to swing and position traders who prefer clearer trends over trade frequency.
Practical application: Use triple MA alignment on a daily chart to filter trades taken on a 1-hour chart. Only enter positions aligned with the dominant higher-timeframe trend direction.
Moving Average Ribbon Strategy
A moving average ribbon plots multiple moving averages—typically 8 to 12 EMAs ranging from 5 to 55 periods—on the same chart. This creates a layered visual representation of trend strength.
Reading the ribbon:
- Tight, parallel ribbons pointing up indicate a strong, healthy uptrend
- Tight, downward ribbons signal a strong downtrend
- Compressed ribbons with MAs crossing repeatedly suggest consolidation or potential reversal
Simple rule-based approach: Enter in the direction where most short MAs are on one side of longer MAs. Exit when the ribbon becomes tangled or reverses order.
Ribbons provide a powerful visual overview across asset classes. Long-term investors use them on weekly charts, while intraday traders apply them to 15-minute timeframes.

How to Build and Trade a Moving Average Crossover Plan
Crossovers should be part of a structured trading plan with documented rules for entries, exits, and position sizing.
Parameter selection by style:
| Trading Style | MA Combination | Timeframe |
|---|---|---|
| Scalpers | 5/13 EMA | 5-minute |
| Day traders | 9/21 EMA | 1-hour |
| Swing traders | 20/50 SMA | Daily |
| Position traders | 50/200 SMA | Daily/Weekly |
Step-by-step trade logic:
- Define the trend regime (trending vs. sideways market)
- Wait for the crossover signal
- Confirm with price action or other technical indicators
- Execute the trade with predetermined position sizing
- Manage exits using your documented rules
Document your rules in a written plan. This prevents emotional decision making during volatile market conditions.
Choosing Timeframes and Markets
The same crossover logic applies across different timeframes, but shorter periods produce more trades and more noise.
Daily and 4-hour charts offer a good starting point—they balance frequency and reliability for retail traders who can’t monitor charts constantly.
Concrete examples:
- 9/21 EMA on BTC/USDT 1-hour chart for crypto traders
- 20/50 SMA on NIFTY 50 daily chart for index traders
- 50/200 SMA on SPY for long-term ETF investors
Different asset classes have different volatility profiles. Crypto and small-cap equities may need shorter lookbacks or additional filters. Large-cap stocks and major forex pairs tend to produce smoother signals.
Start with 5–10 liquid symbols before applying the strategy across hundreds of instruments.
Entry and Exit Rules with Examples
Entry logic example: Go long when 20 SMA crosses above 50 SMA and RSI(14) is above 50. Place a stop below the recent swing low.
Exit strategies:
- Opposite crossover (fast MA crosses back below slow MA)
- Fixed profit targets
- Trailing stops based on ATR (e.g., 2× ATR(14))
- Time-based exits after a certain number of bars
Full trade example: On 02 January 2025, XYZ stock’s 20 SMA crossed above 50 SMA at $100. The trader enters at $101 with a stop at $95 and exit points defined by the reverse crossover. When the 20 SMA crosses back below 50 SMA at $120, the trade closes for a $19 profit per share.
You can also use crossovers as filters rather than triggers. Only take long positions when the fast MA is above the slow MA, while actual entries come from chart pattern setups or pullbacks.
Strengths and Weaknesses of Moving Average Crossover Strategies
Moving average crossovers are classic, easy-to-understand technical tools. They help traders identify and ride the “middle” of trends rather than trying to capture exact tops or bottoms.
Main strengths:
- Simplicity and visual clarity
- Adaptability across asset classes and timeframes
- Objective rules that enforce discipline
- Support from most charting platforms out of the box
Key weaknesses:
- Lagging indicator nature—signals come after the move starts
- Vulnerability to whipsaws in a sideways market
- No built-in risk management or position sizing rules
- Potential for over-optimization on historical price data
Treat moving average crossovers as one component of a broader trading framework, not a standalone solution.
Why Moving Average Crossovers Appeal to Traders
Objective rules reduce emotional overtrading. When a crossover occurs, the decision is binary—signal or no signal—eliminating gut-feeling trades.
Visual cues make interpretation straightforward. Watching two moving averages converge and cross requires no complex calculations, making the approach accessible to beginners.
Crossovers naturally support a trend-following mindset. They encourage traders to ride winners and cut losers, which aligns with profitable trading strategies documented across financial markets.
Many educational resources, scanners, and platforms support MA crossovers. This lowers the barrier to adoption significantly.
Even advanced quantitative traders use moving averages as features or filters in more complex models, proving their enduring value as a technical tool.
Main Risks: Lag, Whipsaws, and Over-Optimization
The lagging nature means a long term moving average like the 200-day can trail price behavior by weeks or months. This results in missed early gains and late exits.
Whipsaw scenario: During sideways periods—like parts of 2015 or 2018 in equity indices—repeated crossovers occur in choppy markets, producing small, frequent losses that erode capital.
Curve-fitting is a common trap. Picking MA lengths that worked perfectly on a single instrument’s historical data often fails in live trading when market conditions shift.
Crossovers alone don’t define risk per trade. Without stops and position sizing, even a strategy generating solid trading signals can suffer large drawdowns.
Start with small position sizes and learn how the strategy behaves across different market regimes before scaling up.
Making Moving Average Crossover Strategies More Effective
Adding context through regime filters, confirmation indicators, and risk management can significantly improve crossover performance.
Market regime matters: Crossovers should be used more aggressively in trending markets and avoided or filtered heavily in range-bound conditions. The ADX indicator can help identify when a clear trend exists.
Combine crossovers with support/resistance levels, price patterns, or momentum indicators like RSI and MACD to validate signals before entry.
Backtest on historical data covering different periods—the 2008 crisis, 2020 COVID crash, and 2021–2022 rotations—to understand how chosen MA pairs perform across market conditions.
Regime Filters and Confirmation Tools
Higher-timeframe filter: Only trade 9/21 EMA crossovers on a 1-hour chart when price is above the 200-day SMA on the daily chart. This ensures short-term trades align with the broader trend.
Volatility filters: Use ATR to avoid entries when volatility is extremely low (range-bound markets) or extremely high (panic moves).
Confirmation examples:
- Require RSI(14) > 50 on buy signal entries
- Require MACD line above its signal line for bullish crossovers
- Look for above-average volume on breakout days
Focus on a few practical filters you can apply consistently rather than an exhaustive list of other indicators.
Risk Management and Position Sizing
Every moving average crossover system should define maximum risk per trade—typically 0.5–2% of account equity—and place logical stop-loss orders.
Stop methods:
- Recent swing high/low
- Multiple of ATR (e.g., 1.5–2× ATR(14)) beyond entry
Scale out or trail stops to lock in profits as moving averages diverge and the trend matures. This captures gains while allowing winners to run.
Diversify by running the strategy on a small basket of uncorrelated assets rather than concentrating on a single instrument. This reduces the impact of transaction costs and individual position losses on cumulative returns.
Review drawdowns and worst-case scenarios in your backtests. Ensure position sizes remain sustainable even during losing streaks.

Backtesting and Optimizing Moving Average Crossover Systems
Backtesting uses historical price data to simulate how specific MA parameters would have performed over time. This step is essential before deploying real capital.
Basic backtest steps:
- Choose markets and timeframes
- Define MA parameters and entry/exit rules
- Run simulations on historical data
- Analyze metrics: total return, drawdown, win rate, profit factor
Optimization involves testing many parameter pairs—fast MA from 5–30 periods, slow MA from 20–200—to find robust settings that work across multiple time periods.
Use out-of-sample testing or walk-forward analysis to reduce overfitting. Traders with coding skills can implement tests in Python or R, while others can use backtesting features built into charting platforms.
Evaluating Performance Beyond Raw Returns
High returns with massive drawdowns may not be practical. Favor stable equity curves with moderate but consistent performance.
Key metrics to track:
- Maximum drawdown
- Profit factor (total profits / total losses)
- Average win vs. average loss
- Number of trades per year
Example: A 20/50 SMA crossover system on a major index from 2000–2025 might produce lower total return than buy-and-hold but with smaller drawdowns. This appeals to risk-averse traders who prioritize capital preservation.
Visualization helps—equity curves and underwater drawdown charts show how the strategy behaves during crises versus trending periods.
Document parameter tests in a spreadsheet for easier comparison when refining your approach.
Frequently Asked Questions About Moving Average Crossover Strategies
Do moving average crossovers really work? They work best in trending markets where momentum persists. In sideways conditions, they generate false signals and small losses. Success depends on combining crossovers with proper risk management.
What are the best moving average combinations? There’s no universal best. Popular choices include 9/21 EMA for short-term, 20/50 SMA for swing trades, and 50/200 SMA for long-term trends. Test combinations on your specific instruments using historical data.
Which time period is best for crossover strategies? Daily and 4-hour charts balance signal quality with reasonable trade frequency. Shorter timeframes like 15-minute charts work but produce more noise.
Are EMAs better than SMAs? EMAs react faster to recent prices, making them suitable for shorter timeframes. SMAs are smoother and often preferred for longer period moving average analysis and weekly charts.
Do crossovers work in crypto and forex? Yes. The principles apply across asset classes. However, crypto’s higher volatility may require shorter lookback periods or additional filters to handle sharp price swings.
How can I reduce false signals? Use higher timeframes, add RSI or MACD confirmation, apply regime filters like ADX, and avoid trading during low-volume conditions.
Moving average crossover strategies provide a solid foundation for systematic trading. They offer clear, objective rules that remove emotional decision making from the equation. Start with one or two MA combinations, test thoroughly on historical data, and refine your approach based on results. Document everything in a written trading plan—consistency beats perfection.