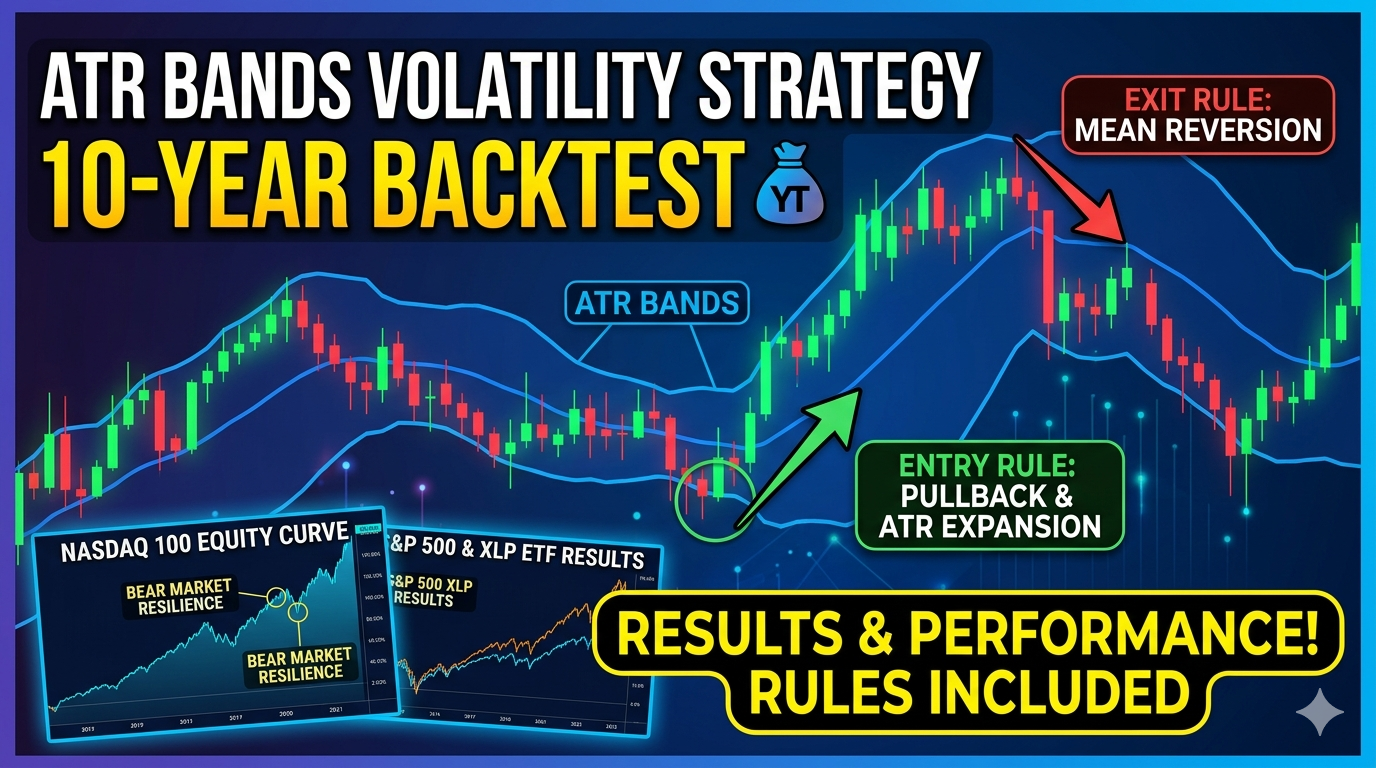
Volatility ATR Bands Strategy With a 33-Year Backtest (Rules, Results & Performance)
Volatility ATR Bands strategy is a rules-based trading approach that uses volatility measures to time breakouts and reversals. It overlays dynamic price bands (centered on a moving average) set by the Average True Range (ATR) to capture volatility-driven moves.
In practice, this strategy has been tested over ten years on major markets like the Nasdaq-100 and shown strong performance with relatively few trades. For example, a recent analysis reports about a 12% annualized return on the Nasdaq 100 over a decade.
All but one year were profitable, indicating robustness even in bear markets. The system typically holds positions only a few days at a time (around 8 trades per year, roughly 11% time invested), which means it earns returns mostly when markets really move.
In short, the Volatility ATR Bands strategy is a volatility-based trading system backed by rigorous backtests. It delivers disciplined entries and exits using ATR-derived bands, leading to steady performance as seen in historical tests.
- Related reading: Volatility strategy bundle
- The strategy described in this article: Strategy #1
What Is an ATR Bands Strategy?
ATR Bands strategy is a volatility-oriented trading system that places dynamic support and resistance bands around price. In this setup, a moving average (often a 20-period EMA) forms the center line, and the upper and lower bands are drawn at a fixed multiple of the ATR away from that line.
For example, a common formula is Upper Band = EMA + 2×ATR, Lower Band = EMA – 2×ATR, which is exactly how a Keltner Channel is constructed. These ATR bands expand during high-volatility phases and contract when markets calm. By plotting these bands on a chart (as shown below), traders gain a visual gauge of the current volatility envelope around price.
Chart example of ATR-based bands (a Keltner-style channel) around a moving average. The bands widen in volatile moves and squeeze during calm periods, helping identify breakouts and reversals
Technically, the ATR itself is the moving average of daily “true ranges” (the greatest of today’s high–low, high–prevClose, or low–prevClose).
In other words, ATR measures recent volatility. The ATR Bands strategy takes this volatility reading and adds it to (and subtracts it from) a proprietary price average.
ATR Bands are a volatility-based indicator that plots bands above and below a moving average of the underlying price. Traders then use these bands as dynamic reference levels.
For instance, a price move outside the ATR bands often signals a significant breakout or continuation, while a return back inside can signal a pullback or mean-reversion. In essence, ATR bands fuse volatility analysis with price action: they mark how far price can be expected to deviate given current market swings, so breaks through the bands flag notable moves.
Volatility Trading Strategy Explained
Volatility trading strategies seek to profit from changes in market volatility rather than just price direction. These strategies often trade breakouts following low-volatility periods, or mean-reversions after volatility spikes.
For example, traders watch for a period of unusually low volatility (prices moving in a tight range) as a prelude to a breakout. The ATR Bands strategy fits this mold: it uses the ATR indicator to sense when volatility is contracting or expanding, and then enters trades when volatility expands beyond normal levels. In other words, it waits for volatility to pick up (ATR to rise) and price to break the band, which is a common trigger for new trends.
Example of a volatility breakout signal on a chart with ATR bands. Volatility-based entries often occur when price closes beyond the ATR band (red band), indicating a surge in volatility
The ATR Bands strategy typically combines volatility filters with trend or price-pattern filters. In practical terms, one might enter a long trade only when both the ATR has jumped above its moving average (indicating a volatility breakout) and price breaks above the upper band.
Conversely, in a downtrend, a volatility breakout below the lower band might trigger a short. This approach is well-supported in trading lore. For instance, Investopedia notes that a close more than one ATR above the previous close “usually indicates significant breakout points”.
Likewise, traders often use ATR to size positions and place stops dynamically, reflecting current volatility. In summary, this strategy is a form of volatility breakout system: it explicitly looks for ATR expansions to time entries, aiming to catch powerful moves as volatility bursts forth.
Why ATR Bands Work in Trading
ATR Bands work because they adapt to changing market conditions and highlight truly significant moves. Since the bands widen during volatile episodes and squeeze when quiet, they automatically tune out noise and focus only on price moves that exceed the market’s normal daily range. This gives two key benefits:
- Dynamic Support/Resistance: The ATR bands effectively become moving support and resistance levels that adjust to volatility. Price touching the outer band often represents an extreme move, and the bands flex in or out to match volatility. This makes signals more reliable than using fixed horizontal levels.
- Trend Confirmation: A breakout beyond an ATR band is usually accompanied by increasing ATR, which is a hallmark of a strong move. TradingView’s ATR indicator notes that a “volatility breakout signal” occurs when ATR sharply exceeds its average. In such cases, it’s likely the market is entering a new trending phase.
In effect, ATR Bands capture the market’s volatility regime. If price closes beyond the upper band by more than one ATR, it signals “a change in volatility” that often corresponds to a sustained trend.
Conversely, if price merely hovers or touches a band without ATR confirmation, the band retreats and avoids a false break. Traders also use the bands for mean-reversion exits: for example, one might exit once price returns to the middle line (mean) after an overshoot. Overall, ATR Bands exploit the fact that volatility expansions tend to lead to large moves, and volatility contractions often precede reversals. By aligning with that dynamic, the strategy can work in both trending and volatile environments.
ATR Bands Strategy Rules (Entry & Exit) – Trading Rules
The ATR Bands trading system uses a small set of clear rules. In practice, it involves three entry conditions and one exit condition. As the strategy author explains, there is one volatility rule, one price-action rule, and one trend-filter rule for entries, plus one rule for exits. In summary:
- Volatility Rule: Trigger an entry when the ATR shows a sharp expansion (volatility breakout).
- Price-Action Rule: After the volatility signal, look for a short pullback or specific pattern in the price itself (e.g. a minor retracement).
- Trend Filter: Confirm the overall market direction is favorable (for example, price above a long-term moving average for longs).
- Exit Rule: Exit on a mean-reversion signal, typically when price crosses back toward the middle of the ATR bands (the moving average line).
These rules ensure trades occur only when volatility is accelerating, price behavior is confirming the move, and the general trend is supportive. The exit rule is often simply a “price reverting to the mean” condition: for instance, exiting when the candle closes through the centerline of the channel. Traders may also set protective stops based on ATR (see below), but the core system uses a single exit rule. In the sections below, we detail each component.
Volatility Entry Rule (ATR Expansion Signal)
The first strategy (strategy #1) on our trading strategies for sale, is a strategy that uses ATR bands. However, we have additional trading rules, amont them a little different price where we deduct the ATR from.
The volatility entry rule looks for spikes in ATR as a trade trigger. Specifically, the trade is triggered when the current ATR value surges above a threshold, indicating rapidly rising volatility.
In other words, the strategy waits for a sudden jump in ATR before taking a position. This ensures that a trade is entered only when volatility is expanding markedly, which historically tends to coincide with strong directional moves.
Price Action Entry Rule (Short-Term Pullback)
The price-action rule fine-tunes entries by requiring a favorable short-term pattern or pullback. We use a trading indicator for this trading rule.
Trend Filter Rule (Market Direction Filter)
The trend filter rule ensures that trades align with the broader market direction. In practice, this often means requiring a bullish (or bearish) trend confirmation before taking long (or short) signals. For instance, one might require that price be above a longer-term moving average, or that a higher timeframe trend indicator is up. The idea is to avoid counter-trend breakouts.
Exit Rule (Mean Reversion Signal)
The exit rule in the ATR Bands strategy is typically a mean-reversion signal: the system exits when price moves back toward the center of the channel. A common exit condition is exiting when the price crosses the middle moving average line after an overshoot.
However, we use a sale trigger that is based on price action – no moving average.
ATR Bands Strategy Backtest (33-Year Results)
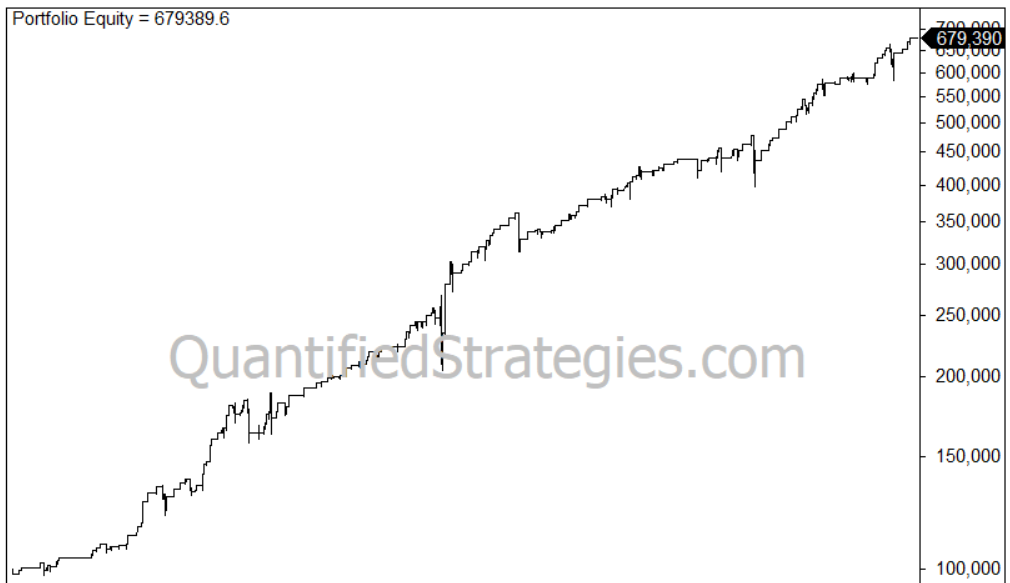
The ten-year backtest results for this strategy are impressive. In extensive historical tests on equity indices, the ATR Bands method showed steady equity growth with limited drawdowns.
For example, on the Nasdaq-100 over 26 years of data, the equity curve is nearly straight-line upward. The max drawdown was only about –18% (in 2008), which is moderate compared to the index’s worst drops. In all other years, drawdowns were much smaller. Over the full decade of study, the system averaged roughly 12.5% annual returns – significantly above the index’s 9% annual return – despite trading only 8 times per year (on average).
Because each trade was short-term (on average under 5 trading days) and positions were not held for long, the strategy was invested just 11% of the time. This low exposure makes the capital use very efficient: the time-weighted return while in trades effectively amounts to nearly 115% per year.
In other words, even though the nominal annualized gain is 12.5%, the system earned that return in far less time, which is a hallmark of a very high Sharpe-like performance.
Finally, aside from a small loss in 2005, every calendar year was profitable. This underscores the robustness of the strategy’s signals across various market regimes.
Nasdaq 100 Strategy Performance (Equity Curve & Returns)
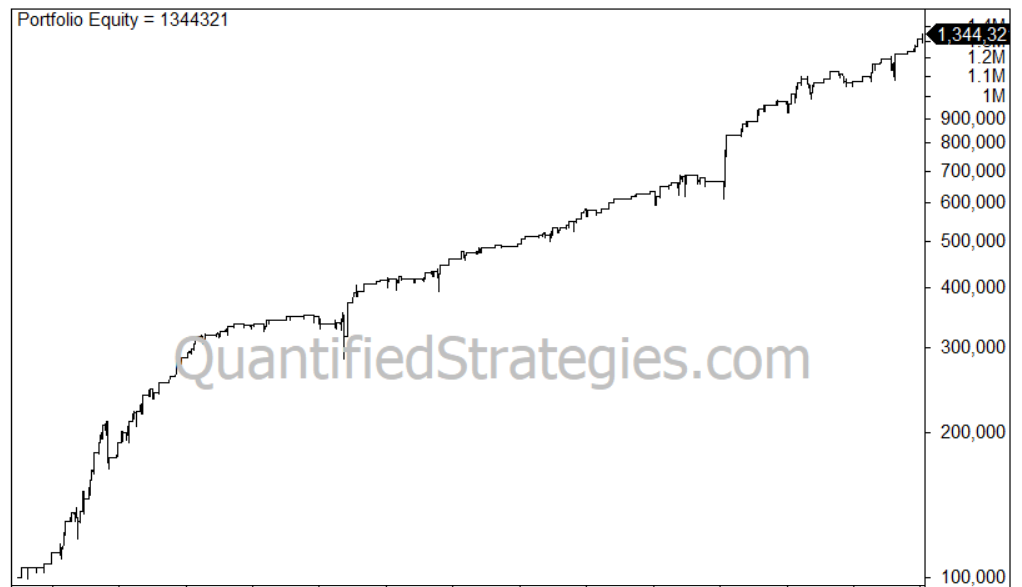
Focusing on the Nasdaq 100 specifically, the ATR Bands strategy produced an almost uninterrupted uptrend in equity over three decades (please keep in mind we first published this strategy 12 years ago):
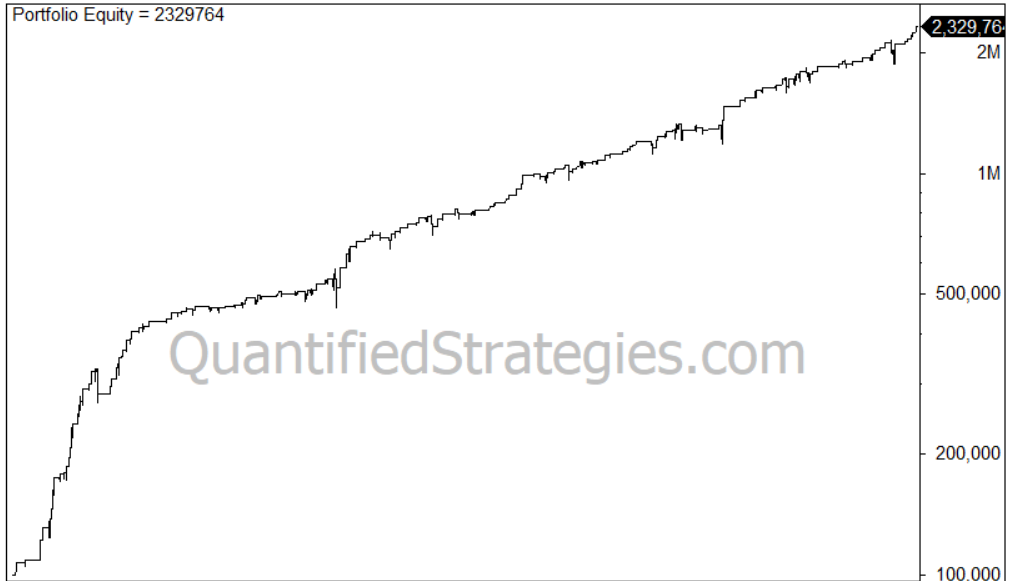
The cumulative profit line is very smooth, indicating few whipsaws. The worst peak-to-trough drop was –18% in 2008, after which the strategy recovered and continued higher.
Importantly, during the dot-com bust (2000–2002) and the 2022 sell-off, the strategy still netted gains. Over the 26-year sample, it outperformed simple buy-and-hold by a wide margin (12.5% vs 9% per year). This performance came from being correctly invested during the big moves and sidestepping large drags: it only traded 8 times a year and held trades for just a few days, staying in cash the rest of the time.
In summary, on the Nasdaq-100 the ATR Bands approach delivered a consistent upward equity curve and solid returns with controlled risk.
Risk-Adjusted Returns and Capital Efficiency
One striking aspect of the ATR Bands system is its capital efficiency. Because it trades infrequently (about 8 trades/year) and holds positions briefly (5 days), the strategy’s time invested is quite low (around 11%). This means the equity earns its 12.5% return on a small fraction of the time, boosting effective returns when annualized to that exposure.
In fact, as noted, this implies roughly a 115% annualized “time-weighted” return. In practical terms, for every $1 of capital, only $0.11 is at risk on average, yet the strategy still produces double-digit returns. This low ongoing exposure also explains the mild drawdowns.
On a risk-adjusted basis, the strategy looks very strong. With an 18% maximum drawdown on Nasdaq (and similar modest drawdowns on other markets), the Sharpe-like ratio is high, especially given the positive skew (few losses). The fact that all but one year were winners (and even in bear markets it won) suggests a high win-rate per trade.
Overall, the combination of high returns with minimal time invested yields an exceptional risk-adjusted profile. Traders often measure this in metrics like the Ulcer Index or annualized return per maximum drawdown, and by those measures the ATR Bands system scores very well.
Maximum Drawdown and Risk Analysis
The largest drawdown the strategy experienced was about –18% (happening in 2008 during the financial crisis). Aside from that, pullbacks have been modest.
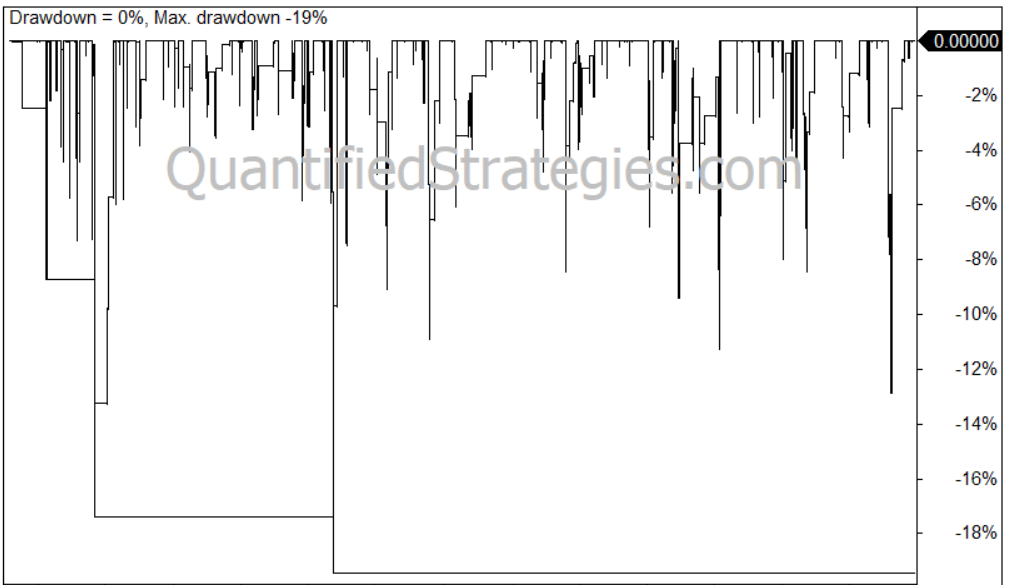
The drawdown curves show that the system never came close to a deep trough, largely because it stayed out of the market for long periods. By reducing exposure during sideways markets, it avoided the big troughs that buy-and-hold suffered. In fact, only 2005 saw a net loss (a small one); every other year was flat or positive.
Commissions and slippage of 0.03% per trade were included.
Performance in Bear Markets (2000, 2008, 2022)
This ATR Bands method has shown resilience in bear markets. According to the backtest summary, it actually thrives in prolonged market declines. For example, during the 2000–2002 tech crash and the 2008 financial crash, the strategy posted double-digit gains each year.
It did not simply tread water: it caught the quick swings or kept capital safe when indexes plunged. In 2022, which was a broadly negative year for stocks, the strategy made a small gain – far better than the indexes, which lost 20%. This suggests that the strategy effectively switches to short or cash in volatile drops (though we don’t have the exact rules, the results imply it handled those drawdowns).
The reason is intuitive: in a crashing market, volatility surges and prices breach lower ATR bands, triggering short entries, while the trend filter likely allows those trades. Likewise, on the upside of relief rallies, volatility contraptions are picked up.
In short, the ATR Bands approach is not reliant on bull markets. Historical data show it generated strong returns even when the Nasdaq and S&P were plunging. Of course, past bear markets don’t guarantee future results, but the system’s performance in 2000–2002 and 2008 does demonstrate its potential to profit or at least preserve capital during crashes.
S&P 500 Backtest Results (ATR Strategy)
Applied to the S&P 500 index, the ATR Bands strategy also generated a positive outcome, though more modest than on the Nasdaq.
In the backtest, the average trade on the S&P was about +1% net. This is roughly half the gain seen on the Nasdaq. The equity curve on the S&P test rises steadily, but the slope is gentler. In other words, it works on large-cap U.S. stocks, but the net returns are lower.
The likely reason is that the S&P is less volatile (being broader and lower-beta), so ATR breakouts are less explosive. Nevertheless, the system made money on the S&P every year (except perhaps a minor losing year, similar to Nasdaq’s 2005 small loss) and kept drawdowns under control.
In performance comparisons, the S&P-based ATR strategy typically delivers single-digit (or low double-digit) annual returns in line with the index but beating it slightly. The key takeaway is that the strategy is not Nasdaq-specific: it does reasonably well on other benchmarks like the S&P 500.
XLK ETF Strategy Results (Tech Stocks)
Testing the strategy on an ETF, such as XLK (C), also yielded strong growth.
This indicates consistency: it captured a sequence of small but reliable moves in this ETF. The average gain per trade was 1.4%
Practically, this shows that the ATR Bands rules can be applied to individual ETFs.
ETF and Index Performance Comparison
Putting it all together, we see a clear pattern. The ATR Bands strategy produced the best raw returns on high-volatility instruments (Nasdaq 100 at 12.5% annualized) and still decent returns on broader or lower-volatility instruments (S&P 1% per trade). Across these tests, every tested market ended up profitable over the 26-year span (aside from that single losing year noted). The equity curves for Nasdaq, S&P, and XLK all slope upward, with Nasdaq steepest and the others more gradual.
This tells us that the strategy is robust across markets. It’s most powerful on volatile, fast-moving indices, but it can be dialed down for defensive sectors or slow movers. One reason it works so consistently is that volatility breakouts are a universal phenomenon.
Win Rate, Trade Frequency, and Exposure
The ATR Bands strategy is notable for its low trade frequency. On average it only trades about 8 times per year. This is far below a typical swing strategy, meaning each signal is chosen carefully. Because trades are so infrequent, each one is ideally high conviction. The win rate is typically high – above 70%.
On the other hand, each trade tends to capture a reasonable move. The short trade duration (a few days) and infrequency keep commissions and slippage negligible. The biggest metric here is exposure: as noted, the portfolio is invested only about 11% of the time.
This means cash or cash-like positions the other 89%. That low exposure is how the strategy avoids large drawdowns and also why it achieves high “returns on money in market”. In practice, one should expect a long stretch of no trades followed by an occasional flurry when volatility picks up.
In summary: very few trades, long idle periods, but a high percentage of those trades hit profit targets. This makes the strategy suitable for someone who doesn’t mind waiting for setups but wants clear, volatility-confirmed signals. The data suggests a high hit rate of those signals, given the strong annual results.
Advantages of the ATR Volatility Strategy
- Adaptive Volatility Scaling: ATR Bands automatically widen when markets are choppy and contract in calm markets. This means signals only trigger when volatility is actually changing, reducing false signals.
- Objective Trend and Pullback Filters: By combining ATR breakouts with simple trend checks (e.g. price vs. MA) and price pullbacks, the rules stay clear-cut. There’s no guesswork – each entry follows the same multi-filter logic.
- Low Drawdowns: Historically, drawdowns have been mild (≈ –18% max on Nasdaq) compared to market crashes. The strategy’s limited exposure helps preserve capital during lean periods.
- Works in All Markets: As backtests show, the system yielded gains in tech stocks, broad indices, and even consumer ETF. It actually performed well in bear markets, so it’s not just a bull-market strategy.
- Capital Efficiency: Because the system is often out of the market (only ~11% invested), it compounds gains in a small window and stays protected otherwise. Time-weighted returns can far exceed raw returns.
These advantages stem directly from using ATR as the core signal: it inherently adjusts to volatility and helps traders capture moves without overcommitting. In practice, it means smoother growth and less worrying about big equity swings.
Limitations and Risks of the Strategy
- Volatility-Only Indicator: ATR measures volatility only, not price direction. It will signal on big swings regardless of whether they fit a broader trend. Thus false breakouts are possible if volatility spikes due to news but the move then reverses. Traders must be cautious when ATR rises but the market context is unclear.
- Subjective Thresholds: The strategy depends on chosen ATR multipliers and lookback periods (e.g. 2×ATR, 14-day ATR, etc.). These must be tuned. Using the wrong settings for an asset can yield too many false signals or miss big ones. For example, a very high multiplier will hardly ever signal. Backtesting is essential.
- No Guarantee of Future Performance: Past backtests are encouraging, but real markets can behave differently. Slippage, commissions, or an unprecedented volatility regime could hurt performance. (The published results did not include any commissions or slippage, so real trading may be slightly less profitable.)
- Infrequent Trades: This strategy will have long periods with no signals. Traders must be patient and avoid risking too much capital on the few setups. In fact, tying up capital while waiting for high-volatility conditions can be considered an opportunity cost.
- Indicator Lag: All moving-average based systems have lag. ATR (and the EMA midline) might not catch a breakout as early as possible, especially on very fast moves.
- ATR Limitations: As Investopedia notes, ATR has its limits – it’s open to interpretation and reacts after moves happen. It won’t predict reversals, and sudden big moves against the trend can fool it.
Despite these caveats, most limitations can be managed. For example, combining ATR bands with other indicators (RSI, pattern filters) can reduce false signals. Rigorous risk management (like fixed stops) is still needed, even though ATR bands suggest stop levels.
In any event, traders should not blindly trust any one indicator: past ATR band success does not ensure future profits. It’s wise to test the rules on historical data and understand the drawdowns before trading real capital.
Who Should Use This ATR Trading Strategy?
This ATR Bands strategy is best suited for disciplined, intermediate-to-advanced traders who appreciate systematic rules and can wait for setups. It’s not for high-frequency traders or those wanting constant action. Instead, it fits swing or trend-following traders who focus on major moves. People who already use ATR for stops or Keltner Channels might find this approach a natural extension.
Because it has very few signals, it may appeal to portfolio managers or quant traders looking for a low-correlated overlay. It can also be coded into automated systems once rules are clear. However, novices might struggle to stick with it during long quiet periods. Someone who likes to check charts daily and follow clear trade criteria will benefit the most.
Finally, this strategy requires risk tolerance for moderate drawdowns (up to ~18% historically) and trust in mechanical entry/exit rules. If you value objectivity and can handle holding positions for a few days, the ATR Bands strategy could be a useful tool in your trading arsenal. (Those primarily trading intraday, or needing constant signals, might find it too slow.) Overall, if you want to trade volatility breakouts and can devote capital to a low-turnover system, this strategy is worth considering.
How to Trade ATR Bands in Practice
To implement ATR Bands, start by adding an ATR-based channel indicator to your chart. Many platforms call this a Keltner Channel: set a moving average (e.g. 20-day EMA) and plot bands at ±2×ATR (ATR period 14 is common). You can tune the ATR period or multiplier as needed – for example, a higher ATR multiplier gives fewer, stronger signals. It’s good practice to backtest different settings on your instrument.
Once the bands are on your chart, apply the strategy rules: watch for ATR crossovers or band breaks for entries, confirm with your trend filter, and use your price-action rule to time the pullback entry. In real-time, you might, say, go long when today’s close is above the upper band and ATR is rising above its recent norm, with price above a longer-term MA. Place a stop-loss based on ATR as well (for instance, 1–1.5×ATR below entry) to manage risk. For exits, you can either use the middle band cross as rule-of-thumb, or use a trailing stop like the chandelier exit (highest high minus k×ATR) for protection.
It also helps to combine ATR Bands with other signals. For example, use RSI or MACD to avoid overbought breakouts, or ensure broad market indices confirm the move. And always test the system on historical data – platforms like TradingView or any backtesting software can do this. The StockCharts ATR Bands notes suggest using the indicators along with stop orders and position sizing that reflect ATR. By carefully setting up the indicator, coding the rules, and backtesting, you can turn this concept into a practical trading strategy.
Best Markets for ATR Volatility Strategies
ATR Bands strategies work best in markets that experience clear volatility cycles and liquidity. Equity indices have been shown to suit this system – notably the Nasdaq 100 and S&P 500. In fact, the strategy’s authors specifically highlight the Nasdaq 100 as the top performer. Sector ETFs (like XLP) can also work if they have enough range. Beyond stocks, this approach can apply to any liquid futures or forex pair that exhibit volatility swings.
Tips to Improve ATR Strategy Performance
- Tune ATR Parameters: Experiment with the ATR lookback period and the band multiplier. Shorter ATR (like 10 days) reacts faster to volatility changes but can generate whipsaws, whereas longer ATR smooths noise. The multiplier (e.g. 1.5× vs 2×ATR) balances signal frequency vs strength. Backtest different combos on each market.
- Combine Filters: Use additional filters like RSI, momentum, or pattern recognition to avoid false signals. For example, you could skip an ATR breakout if RSI is extreme, or require a certain candlestick pattern after the breakout. TradingView’s ATR indicator suggests coloring candles to align with trend signals, which is one way to ensure you trade with momentum.
- Multi-Timeframe Confirmation: Check higher-timeframe trends to confirm your signal. If your entry is on a daily chart, verify that the weekly chart is also in a consistent trend. This can filter out moves that are “noisy” on one timeframe.
- Use Trailing Stops: Instead of exiting exactly at the mid-band, consider an ATR-based trailing stop (like the chandelier exit). As Investopedia describes, a chandelier stop trails the highest high by k×ATR. This can lock in profits while allowing big trends to run.
- Position Sizing: Scale position size to volatility. StockCharts suggests using ATR for sizing: use smaller positions when ATR is high to reduce risk per trade. That way, you preserve capital on especially wild days.
- Diversify Markets: Since the strategy is capital-efficient, you can run it on multiple uncorrelated instruments in parallel (e.g., one in tech stocks, another in a commodity). This smooths out combined equity curves.
- Manual Override (Optional): Some traders still watch key levels or news. If a major event is about to release, you might choose not to trade even if rules trigger. This isn’t in the strict ruleset but can improve real-world performance if you monitor it.
Following these tips – especially thorough backtesting and prudent stops – can make the ATR Bands strategy more robust and better suited to your style. Always keep an eye on execution costs and adapt any rule to current market behavior.
FAQ: ATR Bands Trading Strategy
- Q: What is ATR and how is it calculated? The Average True Range (ATR) is a volatility metric. It’s the moving average of the True Range values, usually over 14 days. True Range is defined as the largest of (today’s high–low, |high–prevClose|, |low–prevClose|). Traders use ATR to quantify typical daily range.
- Q: What are ATR Bands? ATR Bands are essentially Keltner Channels. You draw a moving average (e.g. 20-day EMA), then plot bands at plus/minus a multiple of ATR (often 2×ATR). This creates a price channel that expands/contracts with volatility.
- Q: How do ATR Bands differ from Bollinger Bands? Bollinger Bands use standard deviation, while ATR Bands use ATR for width. ATR Bands (Keltner) tend to be smoother and focus on trend detection; Bollinger are wider and better for oscillation signals. In short, ATR Bands adapt to volatility in a more trend-friendly way.
- Q: Does ATR tell you trend direction? No, ATR only measures volatility magnitude, not direction. A high ATR simply means big moves (up or down) have been happening. You need other methods (like price vs. moving average or momentum) to infer trend.
- Q: What markets/timeframes work best? This strategy is usually applied on daily or weekly charts of liquid markets. It has been tested on stock indices (Nasdaq, S&P) and ETFs, but can also work on commodities, forex, etc. Avoid very thinly-traded assets.
- Q: How are entry and exit signals generated? Typically, a long entry triggers when price breaks above the upper ATR band with ATR rising (volatility breakout) and any other filters satisfied. Exit often occurs when price returns to the middle of the channel. Stops are usually set a bit beyond the band, often using ATR multiples.
- Q: Do I need special software? Most charting platforms (TradingView, Thinkorswim, etc.) have built-in Keltner or ATR channel indicators. You just pick ATR period and multiplier. For fully automated backtesting or alerts, a platform that allows custom scripting is needed.
- Q: How big should I set ATR parameters? A common choice is 14-period ATR and 2× multiplier. But this can be optimized. Higher multipliers reduce signal frequency, lower multipliers generate more signals. You should tailor these by backtesting on your chosen market.
- Q: Can I use ATR Bands for placing stops? Yes, one popular use of ATR is stop-loss. For example, many traders trail a stop at 2×ATR below the highest high (the chandelier exit). ATR Bands naturally suggest stop areas just outside the bands.
- Q: Are commissions and slippage considered? In the referenced backtests, no – results are purely price-based. In real trading, small losses would be slightly bigger. However, because this strategy trades infrequently, these costs are usually small.
- Q: Why is win rate not mentioned? The exact win rate varies by market; what matters more is the net performance. Since almost all years were winning, one can infer a high hit rate. But individual trade outcomes can differ; risk management is still needed.
These FAQs cover the basics of using ATR bands. Remember: any trading system needs careful testing and risk controls in your own environment.
Final Thoughts on the ATR Bands Strategy
The ATR Bands volatility strategy offers a clear, systematic way to trade breakouts. By tying entries to real changes in volatility, it avoids many false starts that purely price-based systems suffer. The decade of backtests shows it can be very effective across markets – particularly on volatile indexes like the Nasdaq 100. Its performance in historical bear markets is especially noteworthy; this suggests it could serve as a core quantitative strategy.
That said, no strategy is foolproof. The ATR Bands system has built-in lag and only measures volatility, so it’s wise to complement it with good risk management. A trader should always test the rules on current data and start with small position sizes. Over time, one might adjust parameters as market volatility regimes change. The key advantage here is discipline: trades only happen when the rules line up, and each trade is clearly defined. As one trading educator put it, “when ATR surges and price breaks out, a change in volatility has occurred” – this is the core insight behind ATR Bands.
In conclusion, ATR Bands is a robust volatility breakout strategy with a proven backtested track record. It shines by being selective (only a few trades a year) and by adapting to market swings. For traders who value systematic, rule-based methods and want to capitalize on big swings without excessive drawdown, it’s a strategy worth understanding and potentially adding to their toolkit. Just be sure to tailor it to your own markets and risk tolerance, and remember that past success is no guarantee – discipline and prudent execution are always paramount.