Volume RSI Trading Strategy – Strategy And Rules
Volume is one of the most overlooked aspects of technical analysis. Most traders rely heavily on price indicators, even though volume can reveal hidden momentum and confirm (or contradict) price action. One way to quantify volume strength is to use the Volume RSI, a variation of the classic Relative Strength Index that applies RSI logic to volume rather than price.
This post explains what Volume RSI is, how it works, how you can use it in systematic strategies, and whether it adds value in real-life trading.
Key Takeaways
- Volume RSI measures volume-based market momentum
- Indicator compares up-volume versus down-volume strength
- Oscillator identifies volume overbought and oversold levels
- Volume RSI confirms price trend participation
- Volume divergences signal potential trend reversals
- Useful for mean reversion trading strategies
- Best combined with price-based indicators
- Works best in liquid equity markets
What Is Volume RSI?
Volume RSI is an oscillator that measures the strength of up-volume versus down-volume over a specified lookback window. Instead of measuring price changes (as the original RSI does), Volume RSI compares:
- Up-volume: volume on days when the price closes higher
- Down-volume: volume on days when the price closes lower
It then normalizes the ratio of up to down volume to a 0–100 oscillator.
In essence, Volume RSI is a volume-momentum indicator.
How Volume RSI Is Calculated
The formula closely mirrors standard RSI:
- Separate the volume into:
- Up Volume (when the close is higher than yesterday)
- Down Volume (when the close is lower)
- Smooth both series using an average (typically an exponential moving average).
- Compute Volume RS (relative strength): RS = (Average Up Volume) / (Average Down Volume)
- Convert RS into RSI format: Volume RSI = 100 – 100 / (1 + RS)
Default lookback is usually 14 periods, but shorter settings (5–10 periods) create a more responsive indicator for active trading.
If you make such a formula in Amibroker (for example), you get the following oscillating indicator (see the second lowest pane – below is also a 5-day RSI for comparison):
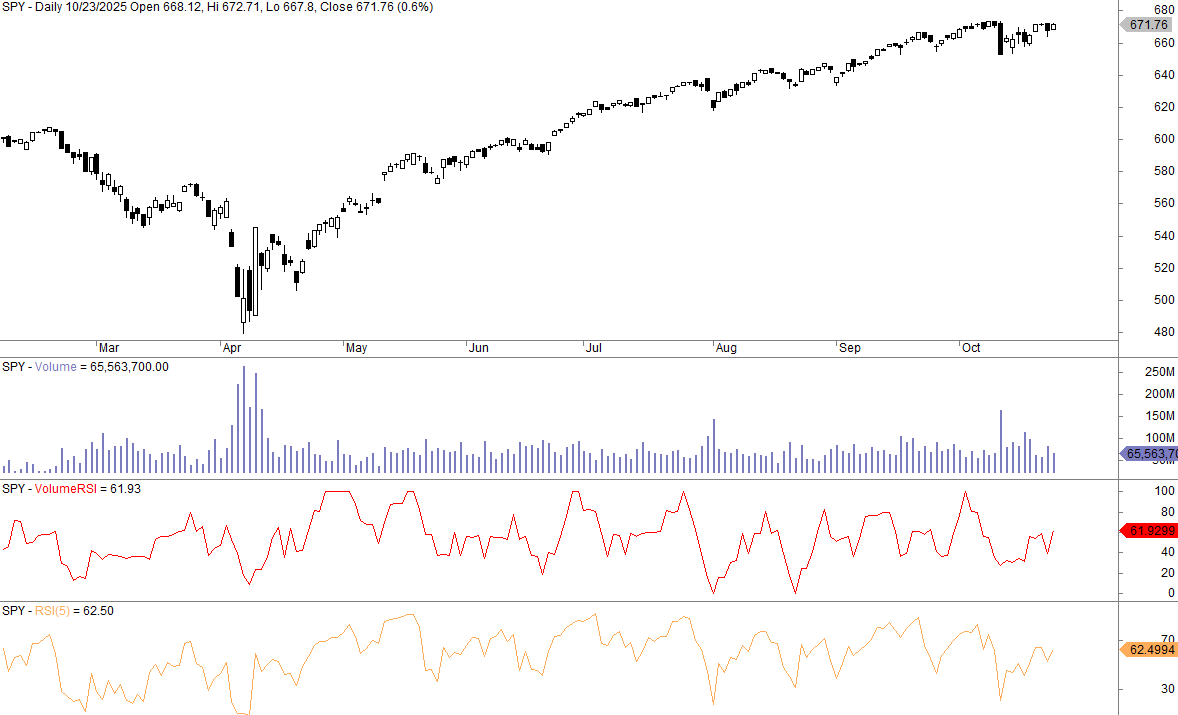
As you can see, the 5-day RSIs are not visually very different.
How to Interpret Volume RSI
Volume RSI behaves very similarly to the classic RSI but provides a different dimension: volume pressure instead of price pressure.
Here are the core interpretations:
1. Overbought and Oversold Conditions
- Above 70: strong up-volume dominance
- Below 30: strong down-volume dominance
A high Volume RSI means volume is flowing aggressively into bullish sessions.
2. Trend Confirmation
If price rises and Volume RSI also rises, the move is supported by volume – a hallmark of healthy trends.
3. Divergences
Like RSI, divergences can signal weakening momentum:
- Price makes a new high, but Volume RSI fails → bullish exhaustion
- Price makes a new low, but Volume RSI rises → bearish exhaustion
Volume divergences often appear earlier than price-momentum divergences.
Volume RSI Trading Strategy
Let’s find out if the Volume RSI works. We make the following trading rules:
THIS SECTION IS FOR MEMBERS ONLY. _________________ BECOME A MEBER TO GET ACCESS TO TRADING RULES IN ALL ARTICLES CLICK HERE TO SEE ALL 400 ARTICLES WITH BACKTESTS & TRADING RULES
This is the equity curve for the S&P 500 from 1993 until today:
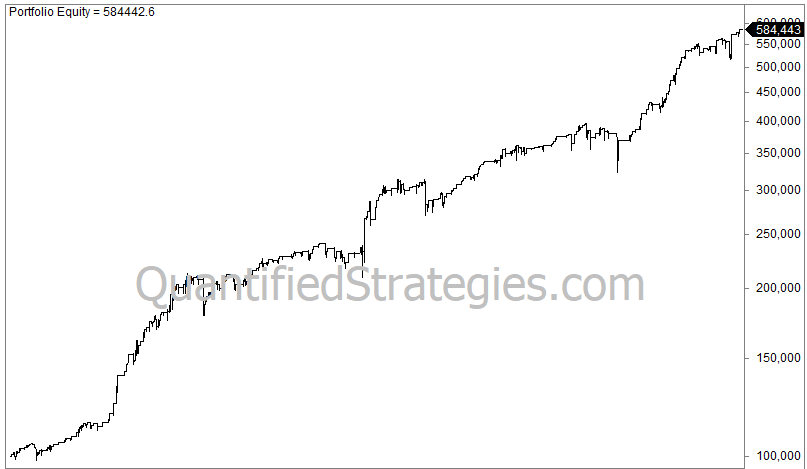
There were 353 trades, and the average gain per trade was 0.5% after commissions and slippage of 0.03% per trade (0.06% for a round-trip). Annual returns were 5.5%, but this has to be measured against being invested only 14% of the time. Max drawdown was a modest 18%.
This is the code for Amibroker:
THIS SECTION IS FOR MEMBERS ONLY. _________________ BECOME A MEBER TO GET ACCESS TO TRADING RULES IN ALL ARTICLES
CLICK HERE TO SEE ALL 400 ARTICLES WITH BACKTESTS & TRADING RULES
We also tweaked the Volume RSI, with improved results. Below is the equity curve from QQQ’s inception until today:
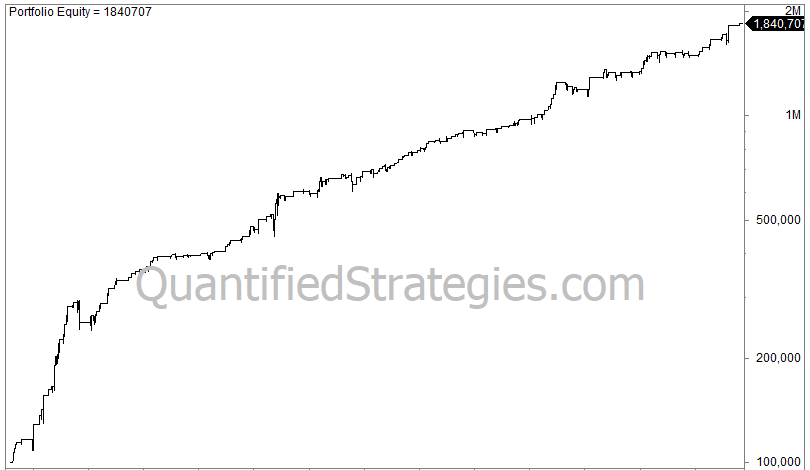
Despite a low trade number of only 225, the CAGR is a solid 11.5% due to the high average gain per trade of 1.3%. Max drawdown is 18%.
Want the trading rules? Become a member!
Why Use Volume RSI? (Benefits for Systematic Traders)
Volume RSI has several attractive features:
1. Adds a Non-Price Dimension
Most indicators are derived from price alone. Volume RSI integrates liquidity and participation – information you cannot get from price.
2. Filters False Breakouts
When Volume RSI fails to confirm a price breakout, the move has a high probability of failing.
3. Works Well in Mean Reversion Systems
Like classic RSI, Volume RSI excels at picking overextended moves in both directions.
4. Can Improve Trend-Following Entries
Trend trades triggered with weak volume often perform poorly. Volume RSI helps avoid these situations.
A Simple Volume RSI Trading Strategy (Example)
Here’s a straightforward mean-reversion setup you can later refine or backtest:
Strategy Rules
- Use Volume RSI(10)
- Buy when:
- Close is above its 200-day moving average
- Volume RSI drops below 25
- Sell when:
- Volume RSI crosses above 55
Why this works
During uptrends, sharp short-term drops with weak volume often represent temporary pullbacks rather than trend reversals. Volume RSI helps identify these spots.
You can add filters like VIX, ATR, or price-based RSI to improve robustness.
Volume RSI vs. Classic RSI: What’s the Difference?
| Indicator | Based On | Measures | Best Use |
|---|---|---|---|
| RSI | Price changes | Price momentum | Mean reversion and overbought/oversold |
| Volume RSI | Up-/down-volume | Volume momentum | Trend confirmation and pullback timing |
Volume RSI tends to be noisier, but also reveals confirming or conflicting volume conditions that the classic RSI cannot show.
Does Volume RSI Work in Backtests?
Volume-based indicators generally show:
- Slightly better performance when combined with price momentum or trend filters
- Limited standalone predictive power
- Good value in regime filters, pullback detection, and breakout confirmation
The best use is not as a primary signal but as a contextual filter in multi-indicator systems.
Limitations of Volume RSI
No indicator is perfect. Weaknesses include:
- Sensitive to illiquid markets
- Does not work well on assets with manipulated or unreliable volume
- May generate large clusters of signals during high-volatility periods
- Best used as a filter, not a standalone trigger
Should You Use Volume RSI in Your Trading?
Volume RSI is useful if:
- You run systematic strategies and want an additional filter
- You trade equities or futures with reliable volume
- You want to improve the quality of breakout or pullback entries
- You monitor divergences as part of discretionary chart reading
It’s less valuable for:
- Forex trading (no centralized volume)
- Very short-term scalping
- Markets with unreliable volume reporting
Used properly, it can add robustness to both trend-following and mean-reversion systems.
Final Thoughts
Volume RSI is a practical and easy-to-understand indicator that improves how traders interpret volume pressure. While it’s not a magic bullet, it’s an excellent supplementary tool for filtering trades, confirming trends, and spotting exhaustion, as indicated with our trading strategies above.